Bed, Bath and Beyond 2014 Annual Report Download - page 22
Download and view the complete annual report
Please find page 22 of the 2014 Bed, Bath and Beyond annual report below. You can navigate through the pages in the report by either clicking on the pages listed below, or by using the keyword search tool below to find specific information within the annual report.-
 1
1 -
2
-
3
-
4
-
5
-
6
-
7
-
8
-
9
-
10
-
11
-
 12
12 -
 13
13 -
 14
14 -
 15
15 -
 16
16 -
 17
17 -
 18
18 -
 19
19 -
 20
20 -
 21
21 -
 22
22 -
 23
23 -
 24
24 -
 25
25 -
 26
26 -
 27
27 -
 28
28 -
 29
29 -
 30
30 -
 31
31 -
 32
32 -
33
-
34
-
35
-
36
-
37
-
38
-
39
-
40
-
41
-
42
-
43
-
44
-
45
-
46
-
47
-
48
-
49
-
50
-
51
-
52
-
53
-
54
-
55
-
56
-
57
-
58
-
59
-
60
-
61
-
62
-
63
-
64
-
65
-
66
-
67
-
68
-
69
-
70
-
71
-
72
-
73
-
74
-
75
-
76
-
77
-
78
-
79
-
80
 |
 |

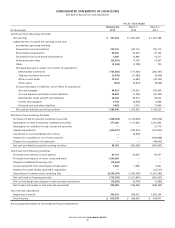
FISCAL YEAR ENDED
(in thousands)
February 28,
2015
March 1,
2014
March 2,
2013
Cash Flows from Operating Activities:
Net earnings $ 957,474 $ 1,022,290 $ 1,037,788
Adjustments to reconcile net earnings to net cash
provided by operating activities:
Depreciation and amortization 239,193 220,116 195,117
Stock-based compensation 66,539 56,244 47,163
Tax benefit from stock-based compensation 6,686 12,846 13,217
Deferred income taxes (22,295) 11,729 17,567
Other (2,244) (1,784) 702
(Increase) decrease in assets, net of effect of acquisitions:
Merchandise inventories (161,506) (117,926) (200,197)
Trading investment securities (9,530) (11,382) (6,206)
Other current assets 19,012 (5,287) (43,703)
Other assets (254) (3,812) (9,690)
Increase (decrease) in liabilities, net of effect of acquisitions:
Accounts payable 44,563 179,522 105,434
Accrued expenses and other current liabilities 18,494 (1,336) (22,167)
Merchandise credit and gift card liabilities 22,520 33,014 36,972
Income taxes payable 3,768 (4,406) 6,588
Deferred rent and other liabilities 3,428 3,735 17,640
Net cash provided by operating activities 1,185,848 1,393,563 1,196,225
Cash Flows from Investing Activities:
Purchase of held-to-maturity investment securities (298,094) (1,156,634) (730,976)
Redemption of held-to-maturity investment securities 677,500 1,117,500 1,031,249
Redemption of available-for-sale investment securities —— 31,715
Capital expenditures (330,637) (320,812) (315,937)
Investment in unconsolidated joint venture —(3,436) —
Payment for acquisitions, net of cash acquired —— (643,098)
Payment for acquisition of trademarks —— (40,000)
Net cash provided by (used in) investing activities 48,769 (363,382) (667,047)
Cash Flows from Financing Activities:
Proceeds from exercise of stock options 41,197 54,815 56,377
Proceeds from issuance of senior unsecured notes 1,500,000 ——
Payment of deferred financing costs (10,092) ——
Excess tax benefit from stock-based compensation 7,202 7,289 5,021
Payment for credit facility assumed in acquisition —— (25,511)
Repurchase of common stock, including fees (2,250,597) (1,283,995) (1,001,280)
Net cash used in financing activities (712,290) (1,221,891) (965,393)
Effect of exchange rate changes on cash and cash equivalents (13,269) (6,745) (1,980)
Net increase (decrease) in cash and cash equivalents 509,058 (198,455) (438,195)
Cash and cash equivalents:
Beginning of period 366,516 564,971 1,003,166
End of period $ 875,574 $ 366,516 $ 564,971
See accompanying Notes to Consolidated Financial Statements.
CONSOLIDATED STATEMENTS OF CASH FLOWS
Bed Bath & Beyond Inc. and Subsidiaries
BED BATH & BEYOND 2014 ANNUAL REPORT
20