Bed, Bath and Beyond 2014 Annual Report Download - page 11
Download and view the complete annual report
Please find page 11 of the 2014 Bed, Bath and Beyond annual report below. You can navigate through the pages in the report by either clicking on the pages listed below, or by using the keyword search tool below to find specific information within the annual report.-
 1
1 -
 2
2 -
 3
3 -
 4
4 -
 5
5 -
 6
6 -
 7
7 -
 8
8 -
 9
9 -
 10
10 -
 11
11 -
 12
12 -
 13
13 -
 14
14 -
 15
15 -
 16
16 -
 17
17 -
 18
18 -
 19
19 -
 20
20 -
 21
21 -
 22
22 -
23
-
24
-
25
-
26
-
27
-
28
-
29
-
30
-
31
-
32
-
33
-
34
-
35
-
36
-
37
-
38
-
39
-
40
-
41
-
42
-
43
-
44
-
45
-
46
-
47
-
48
-
49
-
50
-
51
-
52
-
53
-
54
-
55
-
56
-
57
-
58
-
59
-
60
-
61
-
62
-
63
-
64
-
65
-
66
-
67
-
68
-
69
-
70
-
71
-
72
-
73
-
74
-
75
-
76
-
77
-
78
-
79
-
80
 |
 |
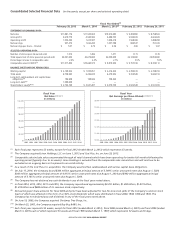
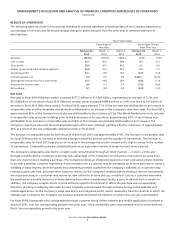
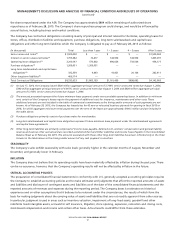
Comparable sales represented $11.517 billion, $10.661 billion and $9.820 billion of net sales for fiscal 2014, 2013 and 2012,
respectively.
Sales of domestics merchandise accounted for approximately 36%, 36% and 39% of net sales in fiscal 2014, 2013 and 2012,
respectively, of which the Company estimates that bed linens accounted for approximately 12% of net sales in fiscal 2014, 2013
and 2012, respectively. The remaining net sales in fiscal 2014, 2013 and 2012 of 64%, 64% and 61%, respectively, represented
sales of home furnishings. No other individual product category accounted for 10% or more of net sales during fiscal 2014,
2013 or 2012.
Gross Profit
Gross profit in fiscal 2014, 2013 and 2012 was $4.620 billion or 38.9% of net sales, $4.566 billion or 39.7% of net sales and
$4.389 billion or 40.2% of net sales, respectively. The decrease in the gross profit margin as a percentage of net sales between
fiscal 2014 and 2013 was primarily attributed to an increase in coupon expense resulting from an increase in redemptions,
partially offset by a slight decrease in the average coupon amount, and an increase in net direct to customer shipping expense,
which was impacted by a reduction in the bedbathandbeyond.com free shipping threshold. The one year anniversary of the
bedbathandbeyond.com free shipping threshold occurred in February 2015. The decrease in the gross profit margin as
a percentage of net sales between fiscal 2013 and 2012 was primarily attributed to an increase in coupons, due to increases in
both redemptions and the average coupon amount, and a shift in the mix of merchandise sold to lower margin categories.
Selling, General and Administrative Expenses
SG&A was $3.065 billion or 25.8% of net sales in fiscal 2014, $2.951 billion or 25.7% of net sales in fiscal 2013 and
$2.751 billion or 25.2% of net sales in fiscal 2012. The percentage of net sales increase in SG&A between fiscal 2014 and 2013
was primarily due to increased technology expenses and related depreciation and increased advertising expenses, partially
offset by relative decreases in payroll and payroll related items (including salaries), occupancy expenses (including rent) and
the year over year net benefits of certain non-recurring items, primarily relating to credit card fee litigation in the fiscal third
quarter of 2014. The increase in technology expenses and related depreciation, as a percentage of net sales, represented
approximately 30 basis points for fiscal 2014 as compared to the same period in the prior year. The increase in SG&A between
fiscal 2013 and 2012 as a percentage of net sales was primarily due to higher technology expenses and depreciation and a
relative increase in payroll and payroll-related items (including salaries, workers’ compensation and medical insurance). The
inclusion of the financial results of the acquisitions for the periods prior to each of their one year anniversaries, which occurred
in the first half of fiscal 2013, also contributed to the increase in SG&A as a percentage of net sales.
Operating Profit
Operating profit for fiscal 2014 was $1.554 billion or 13.1% of net sales, $1.615 billion or 14.0% of net sales in fiscal 2013 and
$1.638 billion or 15.0% of net sales in fiscal 2012. The changes in operating profit as a percentage of net sales between fiscal
2014 and 2013 and between fiscal 2013 and 2012 were the result of the changes in gross profit margin and SG&A as
a percentage of net sales as described above.
The Company believes operating margin compression is likely to continue in fiscal 2015 as a result of several items, including
increases in, as a percentage of net sales, coupon expense, net direct to customer shipping expense, technology expenses
related to the Company’s ongoing investments, a planned unfavorable Canadian currency exchange rate and investments in
compensation and benefits beyond those historically planned. In addition, the operating margin compression will be impacted
by the non-recurring benefit relating to the credit card litigation settlement in fiscal 2014.
Interest Expense, net
Interest expense was $50.5 million, $1.1 million and $4.2 million in fiscal 2014, 2013 and 2012, respectively. The increase in
interest expense for fiscal 2014 was primarily a result of the interest related to the Notes issued in July 2014.
Income Taxes
The effective tax rate was 36.3% for fiscal 2014, 36.6% for fiscal 2013 and 36.5% for fiscal 2012. For fiscal 2014, the tax rate
included net benefits of approximately $20.0 million, primarily due to the recognition of favorable discrete federal and state
tax items. For fiscal 2013 and fiscal 2012, the tax rate included a net benefit of approximately $20.0 million and $26.7 million,
respectively, primarily due to the recognition of favorable discrete state tax items.
BED BATH & BEYOND 2014 ANNUAL REPORT
9