Bed, Bath and Beyond 2014 Annual Report Download - page 29
Download and view the complete annual report
Please find page 29 of the 2014 Bed, Bath and Beyond annual report below. You can navigate through the pages in the report by either clicking on the pages listed below, or by using the keyword search tool below to find specific information within the annual report.-
 1
1 -
2
-
3
-
4
-
5
-
6
-
7
-
8
-
9
-
10
-
11
-
12
-
13
-
14
-
15
-
16
-
17
-
18
-
 19
19 -
 20
20 -
 21
21 -
 22
22 -
 23
23 -
 24
24 -
 25
25 -
 26
26 -
 27
27 -
 28
28 -
 29
29 -
 30
30 -
 31
31 -
 32
32 -
 33
33 -
 34
34 -
 35
35 -
 36
36 -
 37
37 -
 38
38 -
 39
39 -
40
-
41
-
42
-
43
-
44
-
45
-
46
-
47
-
48
-
49
-
50
-
51
-
52
-
53
-
54
-
55
-
56
-
57
-
58
-
59
-
60
-
61
-
62
-
63
-
64
-
65
-
66
-
67
-
68
-
69
-
70
-
71
-
72
-
73
-
74
-
75
-
76
-
77
-
78
-
79
-
80
 |
 |

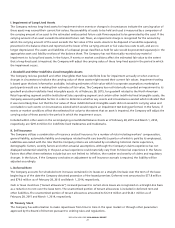
As of February 28, 2015, the Company’s financial assets utilizing Level 1 inputs include long term trading investment securities
traded on active securities exchanges. The Company did not have any financial assets utilizing Level 2 inputs. Financial assets
utilizing Level 3 inputs included long term investments in auction rate securities consisting of preferred shares of closed end
municipal bond funds (See ‘‘Investment Securities,’’ Note 4).
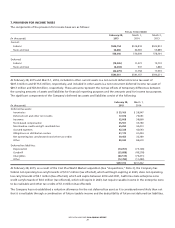
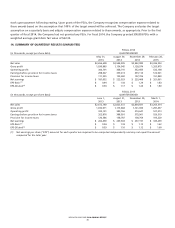
4. INVESTMENT SECURITIES
The Company’s investment securities as of February 28, 2015 and March 1, 2014 are as follows:
(in millions)
February 28,
2015
March 1,
2014
Available-for-sale securities:
Long term $ 47.9 $ 47.7
Trading securities:
Long term 49.2 39.7
Held-to-maturity securities:
Short term 110.0 489.3
Total investment securities $207.1 $576.7
Auction Rate Securities
As of February 28, 2015 and March 1, 2014, the Company’s available-for-sale investment securities represented approximately
$51.0 million par value of auction rate securities, consisting of preferred shares of closed end municipal bond funds, less
temporary valuation adjustments of approximately $3.1 million and $3.3 million, respectively. Since these valuation
adjustments are deemed to be temporary, they are recorded in accumulated other comprehensive loss, net of a related tax
benefit, and did not affect the Company’s net earnings.
U.S. Treasury Securities
As of February 28, 2015 and March 1, 2014, the Company’s short term held-to-maturity securities included approximately
$110.0 million and approximately $489.3 million, respectively, of U.S. Treasury Bills with remaining maturities of less than one
year. These securities are stated at their amortized cost which approximates fair value, which is based on quoted prices in
active markets for identical instruments (i.e., Level 1 valuation).
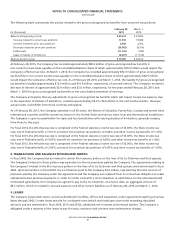
Long Term Trading Investment Securities
The Company’s long term trading investment securities, which are provided as investment options to the participants of the
nonqualified deferred compensation plan, are stated at fair market value. The values of these trading investment securities
included in the table above are approximately $49.2 million and $39.7 million as of February 28, 2015 and March 1, 2014,
respectively.
5. PROPERTY AND EQUIPMENT
Property and equipment consist of the following:
(in thousands)
February 28,
2015
March 1,
2014
Land and buildings $ 557,538 $ 538,422
Furniture, fixtures and equipment 1,179,073 1,120,330
Leasehold improvements 1,258,916 1,187,793
Computer equipment and software 940,754 755,867
3,936,281 3,602,412
Less: Accumulated depreciation (2,259,581) (2,022,608)
Property and equipment, net $ 1,676,700 $ 1,579,804
BED BATH & BEYOND 2014 ANNUAL REPORT
27