Bed, Bath and Beyond 2014 Annual Report Download - page 37
Download and view the complete annual report
Please find page 37 of the 2014 Bed, Bath and Beyond annual report below. You can navigate through the pages in the report by either clicking on the pages listed below, or by using the keyword search tool below to find specific information within the annual report.-
 1
1 -
2
-
3
-
4
-
5
-
6
-
7
-
8
-
9
-
10
-
11
-
12
-
13
-
14
-
15
-
16
-
17
-
18
-
19
-
20
-
21
-
22
-
23
-
24
-
25
-
26
-
 27
27 -
 28
28 -
 29
29 -
 30
30 -
 31
31 -
 32
32 -
 33
33 -
 34
34 -
 35
35 -
 36
36 -
 37
37 -
 38
38 -
 39
39 -
 40
40 -
 41
41 -
 42
42 -
 43
43 -
 44
44 -
 45
45 -
 46
46 -
 47
47 -
48
-
49
-
50
-
51
-
52
-
53
-
54
-
55
-
56
-
57
-
58
-
59
-
60
-
61
-
62
-
63
-
64
-
65
-
66
-
67
-
68
-
69
-
70
-
71
-
72
-
73
-
74
-
75
-
76
-
77
-
78
-
79
-
80
 |
 |

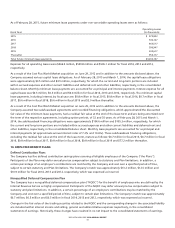
stock upon payment following vesting. Upon grant of the PSUs, the Company recognizes compensation expense related to
these awards based on the assumption that 100% of the target award will be achieved. The Company evaluates the target
assumption on a quarterly basis and adjusts compensation expense related to these awards, as appropriate. Prior to the first
quarter of fiscal 2014, the Company had not granted any PSUs. For fiscal 2014, the Company granted 390,803 PSUs with a
weighted average grant date fair value of $62.34.
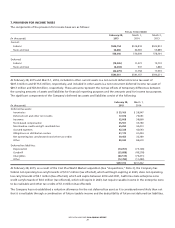
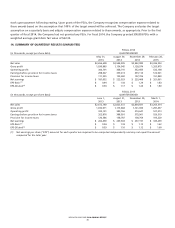
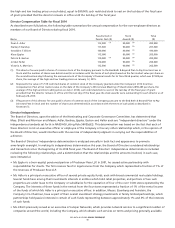
14. SUMMARY OF QUARTERLY RESULTS (UNAUDITED)
(in thousands, except per share data)
FISCAL 2014
QUARTER ENDED
May 31,
2014
August 30,
2014
November 29,
2014
February 28,
2015
Net sales $2,656,698 $2,944,905 $2,942,980 $3,336,593
Gross profit 1,030,885 1,134,045 1,128,974 1,325,875
Operating profit 300,701 368,741 352,683 532,168
Earnings before provision for income taxes 298,607 359,213 333,114 512,901
Provision for income taxes 111,555 135,260 107,706 191,840
Net earnings $ 187,052 $ 223,953 $ 225,408 $ 321,061
EPS-Basic
(1)
$ 0.94 $ 1.18 $ 1.24 $ 1.83
EPS-Diluted
(1)
$ 0.93 $ 1.17 $ 1.23 $ 1.80
(in thousands, except per share data)
FISCAL 2013
QUARTER ENDED
June 1,
2013
August 31,
2013
November 30,
2013
March 1,
2014
Net sales $2,612,140 $2,823,672 $2,864,837 $3,203,314
Gross profit 1,032,971 1,113,484 1,121,690 1,297,437
Operating profit 323,101 389,766 374,647 527,073
Earnings before provision for income taxes 322,876 388,091 375,961 526,519
Provision for income taxes 120,386 138,787 138,764 193,220
Net earnings $ 202,490 $ 249,304 $ 237,197 $ 333,299
EPS-Basic
(1)
$ 0.94 $ 1.18 $ 1.13 $ 1.62
EPS-Diluted
(1)
$ 0.93 $ 1.16 $ 1.12 $ 1.60
(1) Net earnings per share (‘‘EPS’’) amounts for each quarter are required to be computed independently and may not equal the amount
computed for the total year.
BED BATH & BEYOND 2014 ANNUAL REPORT
35