Bed, Bath and Beyond 2014 Annual Report Download - page 19
Download and view the complete annual report
Please find page 19 of the 2014 Bed, Bath and Beyond annual report below. You can navigate through the pages in the report by either clicking on the pages listed below, or by using the keyword search tool below to find specific information within the annual report.-
 1
1 -
2
-
3
-
4
-
5
-
6
-
7
-
8
-
 9
9 -
 10
10 -
 11
11 -
 12
12 -
 13
13 -
 14
14 -
 15
15 -
 16
16 -
 17
17 -
 18
18 -
 19
19 -
 20
20 -
 21
21 -
 22
22 -
 23
23 -
 24
24 -
 25
25 -
 26
26 -
 27
27 -
 28
28 -
 29
29 -
30
-
31
-
32
-
33
-
34
-
35
-
36
-
37
-
38
-
39
-
40
-
41
-
42
-
43
-
44
-
45
-
46
-
47
-
48
-
49
-
50
-
51
-
52
-
53
-
54
-
55
-
56
-
57
-
58
-
59
-
60
-
61
-
62
-
63
-
64
-
65
-
66
-
67
-
68
-
69
-
70
-
71
-
72
-
73
-
74
-
75
-
76
-
77
-
78
-
79
-
80
 |
 |

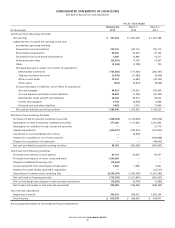
FISCAL YEAR ENDED
(in thousands, except per share data)
February 28,
2015
March 1,
2014
March 2,
2013
Net sales $11,881,176 $11,503,963 $10,914,585
Cost of sales 7,261,397 6,938,381 6,525,830
Gross profit 4,619,779 4,565,582 4,388,755
Selling, general and administrative expenses 3,065,486 2,950,995 2,750,537
Operating profit 1,554,293 1,614,587 1,638,218
Interest expense, net 50,458 1,140 4,159
Earnings before provision for income taxes 1,503,835 1,613,447 1,634,059
Provision for income taxes 546,361 591,157 596,271
Net earnings $ 957,474 $ 1,022,290 $ 1,037,788
Net earnings per share − Basic $ 5.13 $ 4.85 $ 4.62
Net earnings per share − Diluted $ 5.07 $ 4.79 $ 4.56
Weighted average shares outstanding − Basic 186,659 210,710 224,623
Weighted average shares outstanding − Diluted 188,880 213,363 227,723
See accompanying Notes to Consolidated Financial Statements.
CONSOLIDATED STATEMENTS OF EARNINGS
Bed Bath & Beyond Inc. and Subsidiaries
BED BATH & BEYOND 2014 ANNUAL REPORT
17