Bed, Bath and Beyond 2014 Annual Report Download - page 63
Download and view the complete annual report
Please find page 63 of the 2014 Bed, Bath and Beyond annual report below. You can navigate through the pages in the report by either clicking on the pages listed below, or by using the keyword search tool below to find specific information within the annual report.-
 1
1 -
2
-
3
-
4
-
5
-
6
-
7
-
8
-
9
-
10
-
11
-
12
-
13
-
14
-
15
-
16
-
17
-
18
-
19
-
20
-
21
-
22
-
23
-
24
-
25
-
26
-
27
-
28
-
29
-
30
-
31
-
32
-
33
-
34
-
35
-
36
-
37
-
38
-
39
-
40
-
41
-
42
-
43
-
44
-
45
-
46
-
47
-
48
-
49
-
50
-
51
-
52
-
 53
53 -
 54
54 -
 55
55 -
 56
56 -
 57
57 -
 58
58 -
 59
59 -
 60
60 -
 61
61 -
 62
62 -
 63
63 -
 64
64 -
 65
65 -
 66
66 -
 67
67 -
 68
68 -
 69
69 -
 70
70 -
 71
71 -
 72
72 -
 73
73 -
74
-
75
-
76
-
77
-
78
-
79
-
80
 |
 |

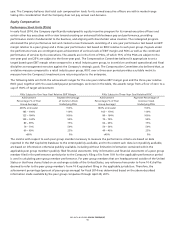
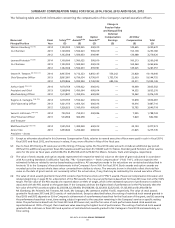
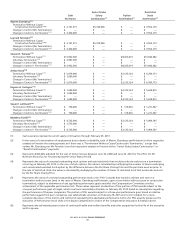
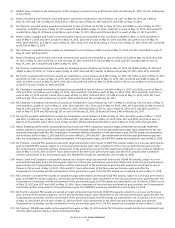
SUMMARY COMPENSATION TABLE FOR FISCAL 2014, FISCAL 2013 AND FISCAL 2012
The following table sets forth information concerning the compensation of the Company’s named executive officers.
Name and
Principal Position
Fiscal
Year
Salary
(1)(2)
($)
Stock
Awards
(3)(4)
($)
Option
Awards
(3)
($)
Change in
Pension Value
and Nonqualified
Deferred
Compensation
Earnings
($)
All Other
Compensation
($)
Total
($)
Warren Eisenberg
(5) (6)
2014 1,100,000 1,500,025 500,010 — 145,635 3,245,670
Co-Chairman 2013 1,100,000 1,500,023 500,019 — 153,138 3,253,180
2012 1,142,308 1,500,033 499,991 — 136,688 3,279,020
Leonard Feinstein
(7) (8)
2014 1,100,000 1,500,025 500,010 — 160,213 3,260,248
Co-Chairman 2013 1,100,000 1,500,023 500,019 — 163,564 3,263,606
2012 1,142,308 1,500,033 499,991 — 145,025 3,287,357
Steven H. Temares
(9) (10) (11)
2014 3,967,500 9,712,323 4,856,147 556,242 23,828 19,116,040
Chief Executive Officer 2013 3,867,981 6,750,034 6,750,011 1,753,736 22,993 19,144,755
2012 3,478,846 5,999,994 5,749,992 684,106 22,211 15,935,149
Arthur Stark
(12) (13)
2014 1,670,769 1,550,022 600,012 — 14,699 3,835,502
President and Chief 2013 1,568,846 1,450,064 600,014 — 14,352 3,633,276
Merchandising Officer 2012 1,513,847 1,350,016 600,003 — 12,262 3,476,128
Eugene A. Castagna
(14) (15)
2014 1,670,769 1,550,022 600,012 — 13,878 3,834,681
Chief Operating Officer 2013 1,421,154 1,450,126 600,014 — 16,416 3,487,710
2012 1,326,923 1,100,010 600,003 — 13,782 3,040,718
Susan E. Lattmann
(16) (17)
2014 730,769 750,013 300,006 — 7,955 1,788,743
Chief Financial Officer 2013 534,908 300,058 — — 7,820 842,786
and Treasurer
Matthew Fiorilli
(18) (19)
2014 1,555,769 1,300,038 600,012 — 22,154 3,477,973
Senior Vice 2013 1,453,846 1,200,060 600,014 — 21,825 3,275,745
President − Stores
(1) Except as otherwise described in this Summary Compensation Table, salaries to named executive officers were paid in cash in fiscal 2014,
fiscal 2013 and fiscal 2012, and increases in salary, if any, were effective in May of the fiscal year.
(2) Due to fiscal 2012 being a 53 week year and the timing of the pay cycles, the fiscal 2012 salary amounts include an additional pay period.
Without this additional pay period, fiscal 2012 salaries would have been $1,100,000 each for Messrs. Eisenberg and Feinstein as their salaries
were for the prior six fiscal years and $3,346,154, $1,456,924 and $1,276,923 for Messrs. Temares, Stark and Castagna, respectively.
(3) The value of stock awards and option awards represents their respective total fair value on the date of grant calculated in accordance
with Accounting Standards Codification Topic No. 718, ‘‘Compensation — Stock Compensation’’ (‘‘ASC 718’’), without regard to the
estimated forfeiture related to service-based vesting conditions. All assumptions made in the valuations are contained and described in
footnote 13 to the Company’s financial statements in the Company’s Form 10-K for fiscal 2014. Stock awards and option awards are
rounded up to the nearest whole share when converted from dollars to shares. The amounts shown in the table reflect the total fair
value on the date of grant and do not necessarily reflect the actual value, if any, that may be realized by the named executive officers.
(4) The value of stock awards granted in fiscal 2014 consists of performance stock unit (‘‘PSU’’) awards. Please see Compensation Discussion and
Analysis beginning on page 53 for a description of the PSU awards. The one-year performance-based test for fiscal 2014 was met at the 100%
target. The fair value of the PSU awards are reported above at 100% of target, which is the estimated outcome of performance conditions
associated with the PSU awards on the grant date. If the Company achieves the highest level of performance for the PSU awards, then the
fair value of the PSU awards would be $2,250,038, $2,250,038, $14,568,546, $2,325,033, $2,325,033, $1,125,050 and $1,950,058 for
Mr. Eisenberg, Mr. Feinstein, Mr. Temares, Mr. Stark, Mr. Castagna, Ms. Lattmann and Mr. Fiorilli, respectively. The value of stock awards
granted in fiscal years 2013 and 2012 consists of restricted stock. Except as described below, the vesting of restricted stock awards granted in
fiscal 2013 and 2012 depends on (i) the Company’s achievement of a performance-based test for the fiscal year of the grant, and (ii) assuming
the performance-based test is met, time vesting, subject in general to the executive remaining in the Company’s service on specific vesting
dates. The performance-based tests for fiscal 2013 and 2012 were met, and the fair value of such performance-based stock awards are
reported above at 100% of target, their maximum value assuming the highest level of performance. The vesting of restricted stock awards
granted to Ms. Lattmann in fiscal 2013 and a portion of restricted stock awards granted to Mr. Castagna in fiscal 2013 are based solely on
time vesting.
BED BATH & BEYOND PROXY STATEMENT
61