Bed, Bath and Beyond 2014 Annual Report Download - page 21
Download and view the complete annual report
Please find page 21 of the 2014 Bed, Bath and Beyond annual report below. You can navigate through the pages in the report by either clicking on the pages listed below, or by using the keyword search tool below to find specific information within the annual report.-
 1
1 -
2
-
3
-
4
-
5
-
6
-
7
-
8
-
9
-
10
-
 11
11 -
 12
12 -
 13
13 -
 14
14 -
 15
15 -
 16
16 -
 17
17 -
 18
18 -
 19
19 -
 20
20 -
 21
21 -
 22
22 -
 23
23 -
 24
24 -
 25
25 -
 26
26 -
 27
27 -
 28
28 -
 29
29 -
 30
30 -
 31
31 -
32
-
33
-
34
-
35
-
36
-
37
-
38
-
39
-
40
-
41
-
42
-
43
-
44
-
45
-
46
-
47
-
48
-
49
-
50
-
51
-
52
-
53
-
54
-
55
-
56
-
57
-
58
-
59
-
60
-
61
-
62
-
63
-
64
-
65
-
66
-
67
-
68
-
69
-
70
-
71
-
72
-
73
-
74
-
75
-
76
-
77
-
78
-
79
-
80
 |
 |

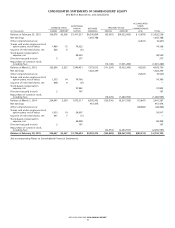
COMMON STOCK ADDITIONAL
PAID-IN
CAPITAL
RETAINED
EARNINGS
TREASURY STOCK
ACCUMULATED
OTHER
COMPREHENSIVE
LOSS TOTAL(in thousands) SHARES AMOUNT SHARES AMOUNT
Balance at February 25, 2012 330,576 $3,306 $1,417,337 $6,535,824 (95,061) $(4,032,060) $ (1,879) $ 3,922,528
Net earnings 1,037,788 1,037,788
Other comprehensive loss (2,441) (2,441)
Shares sold under employee stock
option plans, net of taxes 1,489 15 74,323 74,338
Issuance of restricted shares, net 626 6 (6) —
Stock-based compensation
expense, net 48,520 48,520
Director fees paid in stock 5 277 277
Repurchase of common stock,
including fees (16,146) (1,001,280) (1,001,280)
Balance at March 2, 2013 332,696 3,327 1,540,451 7,573,612 (111,207) (5,033,340) (4,320) 4,079,730
Net earnings 1,022,290 1,022,290
Other comprehensive loss (9,527) (9,527)
Shares sold under employee stock
option plans, net of taxes 1,375 14 74,766 74,780
Issuance of restricted shares, net 868 9 (9) —
Stock-based compensation
expense, net 57,842 57,842
Director fees paid in stock 2 167 167
Repurchase of common stock,
including fees (18,329) (1,283,995) (1,283,995)
Balance at March 1, 2014 334,941 3,350 1,673,217 8,595,902 (129,536) (6,317,335) (13,847) 3,941,287
Net earnings 957,474 957,474
Other comprehensive loss (28,466) (28,466)
Shares sold under employee stock
option plans, net of taxes 1,033 10 54,907 54,917
Issuance of restricted shares, net 691 7 (7) —
Stock-based compensation
expense, net 68,408 68,408
Director fees paid in stock 2 167 167
Repurchase of common stock,
including fees (32,953) (2,250,597) (2,250,597)
Balance at February 28, 2015 336,667 $3,367 $1,796,692 $9,553,376 (162,489) $(8,567,932) $(42,313) $ 2,743,190
See accompanying Notes to Consolidated Financial Statements.
CONSOLIDATED STATEMENTS OF SHAREHOLDERS’ EQUITY
Bed Bath & Beyond Inc. and Subsidiaries
BED BATH & BEYOND 2014 ANNUAL REPORT
19