Bed, Bath and Beyond 2014 Annual Report Download - page 13
Download and view the complete annual report
Please find page 13 of the 2014 Bed, Bath and Beyond annual report below. You can navigate through the pages in the report by either clicking on the pages listed below, or by using the keyword search tool below to find specific information within the annual report.-
 1
1 -
2
-
 3
3 -
 4
4 -
 5
5 -
 6
6 -
 7
7 -
 8
8 -
 9
9 -
 10
10 -
 11
11 -
 12
12 -
 13
13 -
 14
14 -
 15
15 -
 16
16 -
 17
17 -
 18
18 -
 19
19 -
 20
20 -
 21
21 -
 22
22 -
 23
23 -
24
-
25
-
26
-
27
-
28
-
29
-
30
-
31
-
32
-
33
-
34
-
35
-
36
-
37
-
38
-
39
-
40
-
41
-
42
-
43
-
44
-
45
-
46
-
47
-
48
-
49
-
50
-
51
-
52
-
53
-
54
-
55
-
56
-
57
-
58
-
59
-
60
-
61
-
62
-
63
-
64
-
65
-
66
-
67
-
68
-
69
-
70
-
71
-
72
-
73
-
74
-
75
-
76
-
77
-
78
-
79
-
80
 |
 |
On August 6, 2014, the Company entered into the Revolver with various lenders. During the period from August 6, 2014
through February 28, 2015, the Company did not have any borrowings under the Revolver.
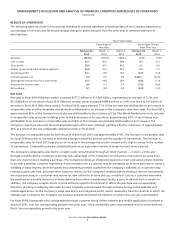
Fiscal 2014 compared to Fiscal 2013
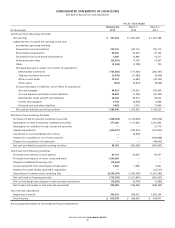
Net cash provided by operating activities in fiscal 2014 was $1.186 billion, compared with $1.394 billion in fiscal 2013. Year
over year, the Company experienced an increase in cash used by the net components of working capital (primarily accounts
payable and merchandise inventories, partially offset by other current assets and accrued expenses and other current
liabilities) and a decrease in net earnings, as adjusted for non-cash expenses (primarily deferred income taxes and
depreciation).
Retail inventory at cost per square foot was $62.58 as of February 28, 2015, as compared to $59.68 as of March 1, 2014.
Net cash provided by investing activities in fiscal 2014 was $48.8 million, compared with net cash used in investing activities of
$363.4 million in fiscal 2013. In fiscal 2014, net cash provided by investing activities was primarily due to $379.4 million of
redemptions of investment securities, net of purchases, partially offset by $330.6 million of capital expenditures. In fiscal 2013,
net cash used in investing activities was primarily due to $320.8 million of capital expenditures and $39.1 million of purchases
of investment securities, net of redemptions.
Net cash used in financing activities for fiscal 2014 was $712.3 million, compared with $1.222 billion in fiscal 2013. The
decrease in net cash used was primarily due to proceeds from the issuance of the Notes of $1.5 billion, partially offset by an
increase in common stock repurchases of $966.6 million, which includes the shares repurchased under the ASR.
Fiscal 2013 compared to Fiscal 2012
Net cash provided by operating activities in fiscal 2013 was $1.394 billion, compared with $1.196 billion in fiscal 2012. Year
over year, the Company experienced an increase in cash provided by the net components of working capital (primarily
merchandise inventories, accounts payable and other current assets) and an increase in net earnings, as adjusted for non-cash
expenses (primarily depreciation).
Retail inventory at cost per square foot was $59.68 as of March 1, 2014, as compared to $58.12 as of March 2, 2013.
Net cash used in investing activities in fiscal 2013 was $363.4 million, compared with $667.0 million in fiscal 2012. In fiscal 2013,
net cash used in investing activities was primarily due to $320.8 million of capital expenditures and $39.1 million of purchases
of investment securities, net of redemptions. In fiscal 2012, net cash used in investing activities was due to payments, net of
cash acquired, of $643.1 million related to the Cost Plus World Market and Linen Holdings acquisitions, $315.9 million for
capital expenditures and $40.0 million for the acquisition of trademarks, partially offset by redemptions of $332.0 million of
investment securities, net of purchases.
Net cash used in financing activities for fiscal 2013 was $1.222 billion, compared with $965.4 million in fiscal 2012. The increase
in net cash used was primarily due to an increase in common stock repurchases of $282.7 million, partially offset by a
$25.5 million payment in the prior year for a credit facility assumed in connection with an acquisition.
Other Fiscal 2014 Information
At February 28, 2015, the Company maintained two uncommitted lines of credit of $100 million each, with expiration dates of
September 1, 2015 and February 28, 2016, respectively. These uncommitted lines of credit are currently and are expected to be
used for letters of credit in the ordinary course of business. During fiscal 2014, the Company did not have any direct
borrowings under the uncommitted lines of credit. As of February 28, 2015, there was approximately $11.1 million of
outstanding letters of credit. Although no assurances can be provided, the Company intends to renew both uncommitted lines
of credit before the respective expiration dates. In addition, as of February 28, 2015, the Company maintained unsecured
standby letters of credit of $71.7 million, primarily for certain insurance programs.
The Company has authorization to make repurchases from time to time in the open market or through other parameters
approved by the Board of Directors pursuant to existing rules and regulations.
Between December 2004 and July 2014, the Company’s Board of Directors authorized, through several share repurchase
programs, the repurchase of $9.450 billion of the Company’s common stock. Since 2004 through the end of fiscal 2014, the
Company has repurchased approximately $8.6 billion of its common stock through share repurchase programs, which include
BED BATH & BEYOND 2014 ANNUAL REPORT
11