Bed, Bath and Beyond 2014 Annual Report Download - page 10
Download and view the complete annual report
Please find page 10 of the 2014 Bed, Bath and Beyond annual report below. You can navigate through the pages in the report by either clicking on the pages listed below, or by using the keyword search tool below to find specific information within the annual report.-
 1
1 -
 2
2 -
 3
3 -
 4
4 -
 5
5 -
 6
6 -
 7
7 -
 8
8 -
 9
9 -
 10
10 -
 11
11 -
 12
12 -
 13
13 -
 14
14 -
 15
15 -
 16
16 -
 17
17 -
 18
18 -
 19
19 -
 20
20 -
 21
21 -
22
-
23
-
24
-
25
-
26
-
27
-
28
-
29
-
30
-
31
-
32
-
33
-
34
-
35
-
36
-
37
-
38
-
39
-
40
-
41
-
42
-
43
-
44
-
45
-
46
-
47
-
48
-
49
-
50
-
51
-
52
-
53
-
54
-
55
-
56
-
57
-
58
-
59
-
60
-
61
-
62
-
63
-
64
-
65
-
66
-
67
-
68
-
69
-
70
-
71
-
72
-
73
-
74
-
75
-
76
-
77
-
78
-
79
-
80
 |
 |

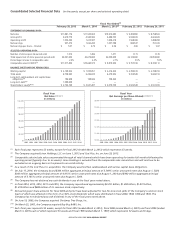
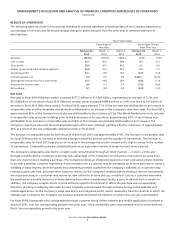
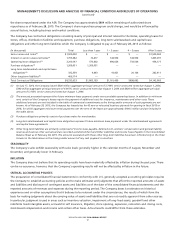
RESULTS OF OPERATIONS
The following table sets forth for the periods indicated (i) selected statement of earnings data of the Company expressed as
a percentage of net sales and (ii) the percentage change in dollar amounts from the prior year in selected statement of
earnings data:
Fiscal Year Ended
Percentage of
Net Sales
Percentage Change
from Prior Year
February 28,
2015
March 1,
2014
March 2,
2013
February 28,
2015
March 1,
2014
Net sales 100.0% 100.0% 100.0% 3.3% 5.4%
Cost of sales 61.1 60.3 59.8 4.7 6.3
Gross profit 38.9 39.7 40.2 1.2 4.0
Selling, general and administrative expenses 25.8 25.7 25.2 3.9 7.3
Operating profit 13.1 14.0 15.0 (3.7) (1.4)
Interest expense, net 0.4 0.0 0.0 4,326.1 (72.6)
Earnings before provision for income taxes 12.7 14.0 15.0 (6.8) (1.3)
Provision for income taxes 4.6 5.1 5.5 (7.6) (0.9)
Net earnings 8.1 8.9 9.5 (6.3) (1.5)
Net Sales
Net sales in fiscal 2014 (fifty-two weeks) increased $377.2 million to $11.881 billion, representing an increase of 3.3% over
$11.504 billion of net sales in fiscal 2013 (fifty-two weeks), which increased $589.4 million or 5.4% over the $10.915 billion of
net sales in fiscal 2012 (fifty-three weeks). For fiscal 2014, approximately 71% of the increase was attributable to an increase in
comparable sales and the remainder was primarily attributable to an increase in the Company’s new store sales. For fiscal 2013,
approximately 62% of the increase in net sales was attributable to the inclusion of Cost Plus World Market prior to its inclusion
in comparable sales and Linen Holdings prior to the anniversary of its acquisition, approximately 42% of the increase was
attributable to an increase in comparable sales and 26% of the increase was primarily attributable to an increase in the
Company’s new store sales and the post-acquisition period for Linen Holdings, partially offset by a decrease of approximately
30% as a result of the non-comparable additional week in fiscal 2012.
The increase in comparable sales for both fiscal 2014 and fiscal 2013 was approximately 2.4%. The increase in comparable sales
for fiscal 2014 was due to increases in both the average transaction amount and the number of transactions. The increase in
comparable sales for fiscal 2013 was due to an increase in the average transaction amount and a slight increase in the number
of transactions. Comparable sales are calculated based on an equivalent number of weeks for each annual period.
The Company’s comparable sales metric considers sales consummated through all retail channels — in-store, online and
through a mobile device. Customers today may take advantage of the Company’s omnichannel environment by using more
than one channel when making a purchase. The Company believes an integrated experience must exist among these channels
to provide a seamless customer experience. A few examples are: a customer may be assisted by an in-store associate to create a
wedding or baby registry, while the guests may ultimately purchase a gift from the Company’s websites; or, a customer may
research a particular item, and read other customer reviews on the Company’s websites before visiting a store to consummate
the actual purchase; or a customer may reserve an item online for in-store pick up; or while in a store, a customer may make
the purchase on a mobile device for in home delivery from either a distribution facility, a store or directly from a vendor. In
addition, the Company accepts returns in-store without regard to the channel in which the purchase was consummated,
therefore resulting in reducing store sales by sales originally consummated through customer facing online websites and
mobile applications. As the Company’s retail operations are integrated and it cannot reasonably track the channel in which the
ultimate sale is initiated, the Company can however provide directional information on where the sale was consummated.
For fiscal 2014, comparable sales consummated through customer facing online websites and mobile applications increased in
excess of 50%, over the corresponding period in the prior year, while comparable sales consummated in-store were relatively
flat to the corresponding period in the prior year.
MANAGEMENT’S DISCUSSION AND ANALYSIS OF FINANCIAL CONDITION AND RESULTS OF OPERATIONS
(continued)
BED BATH & BEYOND 2014 ANNUAL REPORT
8