Bed, Bath and Beyond 2014 Annual Report Download - page 58
Download and view the complete annual report
Please find page 58 of the 2014 Bed, Bath and Beyond annual report below. You can navigate through the pages in the report by either clicking on the pages listed below, or by using the keyword search tool below to find specific information within the annual report.-
 1
1 -
2
-
3
-
4
-
5
-
6
-
7
-
8
-
9
-
10
-
11
-
12
-
13
-
14
-
15
-
16
-
17
-
18
-
19
-
20
-
21
-
22
-
23
-
24
-
25
-
26
-
27
-
28
-
29
-
30
-
31
-
32
-
33
-
34
-
35
-
36
-
37
-
38
-
39
-
40
-
41
-
42
-
43
-
44
-
45
-
46
-
47
-
 48
48 -
 49
49 -
 50
50 -
 51
51 -
 52
52 -
 53
53 -
 54
54 -
 55
55 -
 56
56 -
 57
57 -
 58
58 -
 59
59 -
 60
60 -
 61
61 -
 62
62 -
 63
63 -
 64
64 -
 65
65 -
 66
66 -
 67
67 -
 68
68 -
69
-
70
-
71
-
72
-
73
-
74
-
75
-
76
-
77
-
78
-
79
-
80
 |
 |

year. The Company believes that total cash compensation levels for its named executive officers are within market range
taking into consideration that the Company does not pay annual cash bonuses.
Equity Compensation
Performance Stock Units (PSUs)
In early fiscal 2014, the Company significantly redesigned its equity incentive program for its named executive officers and
certain other key executives with a view toward creating an enhanced link between pay and performance, providing
performance metrics fundamental to the business, and aligning with shareholder value creation. The redesigned program
eliminated the prior performance test and created a new framework consisting of a one-year performance test based on EBIT
margin relative to a peer group and a three-year performance test based on ROIC relative to such peer group. Payouts under
the performance tests are contingent upon achievement of various levels of EBIT margin and ROIC as well as the continued
performance of services by the executives. The awards are in the form of PSUs, of which 75% of the PSUs are subject to the
one-year goal and 25% are subject to the three-year goal. The Compensation Committee believed it appropriate to set a
target based upon EBIT margin when compared to a retail industry peer group, to incentivize continued operational and fiscal
discipline as management executes against the Company’s strategic goals. The Compensation Committee also believed that, as
a relative measure compared to a retail industry peer group, ROIC over a three-year period provides a suitable metric to
measure how the Company’s investments are returning value to the enterprise.
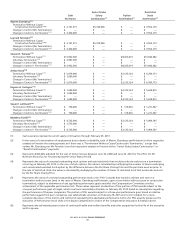
The following table sets forth the achievement ranges for the one-year relative EBIT margin goal and the three-year relative
ROIC goal, together with the associated payout percentages. As shown in the table, the awards range from a floor of zero to a
cap of 150% of target achievement:
PSUs Subject to One-Year Goal Relative EBIT Margin PSUs Subject to Three-Year Goal Relative ROIC
Achievement
Percentage (% of Peer
Group Average)
Payment Percentage
of Common Stock
Underlying PSUs
Achievement
Percentage (% of Peer
Group Average)
Payment Percentage of
Common Stock
Underlying PSUs
200% or Greater 150% 180% or Greater 150%
185 − 199% 110% 165 − 179% 110%
125 − 184% 100% 80 − 164% 100%
100 − 124% 90% 70 − 79% 90%
80 − 99% 75% 60 − 69% 75%
70 − 79% 50% 50 − 59% 50%
60 − 69% 25% 40 − 49% 25%
<60% 0% <40% 0%
The metrics with respect to each peer group member necessary to measure the performance criteria are based on data
reported in the S&P Capital IQ Database to the extent publicly available, and to the extent such data is not publicly available,
are based on information otherwise publicly available, including without limitation information contained within the
applicable peer group member’s publicly filed financial statements. Only information and financial statements of a peer group
member filed in the performance period prior to the Company’s filing of its Form 10-K for the applicable performance period
is used in calculating peer group member performance. For peer group members that are headquartered outside of the United
States or that have shares listed on an exchange outside of the United States, any reference hereunder to Form 10-K shall be
deemed to refer to the peer group member’s Form 10-K equivalent filing in the applicable jurisdiction. Therefore, the
achievement percentage (percent of peer group average) for fiscal 2014 was determined based on the above-described
information made available by the peer group companies through April 28, 2015.
BED BATH & BEYOND PROXY STATEMENT
56