Avon 2006 Annual Report Download - page 75
Download and view the complete annual report
Please find page 75 of the 2006 Avon annual report below. You can navigate through the pages in the report by either clicking on the pages listed below, or by using the keyword search tool below to find specific information within the annual report.-
 1
1 -
2
-
3
-
4
-
5
-
6
-
7
-
8
-
9
-
10
-
11
-
12
-
13
-
14
-
15
-
16
-
17
-
18
-
19
-
20
-
21
-
22
-
23
-
24
-
25
-
26
-
27
-
28
-
29
-
30
-
31
-
32
-
33
-
34
-
35
-
36
-
37
-
38
-
39
-
40
-
41
-
42
-
43
-
44
-
45
-
46
-
47
-
48
-
49
-
50
-
51
-
52
-
53
-
54
-
55
-
56
-
57
-
58
-
59
-
60
-
61
-
62
-
63
-
64
-
 65
65 -
 66
66 -
 67
67 -
 68
68 -
 69
69 -
 70
70 -
 71
71 -
 72
72 -
 73
73 -
 74
74 -
 75
75 -
 76
76 -
 77
77 -
 78
78 -
 79
79 -
 80
80 -
 81
81 -
 82
82 -
 83
83 -
 84
84 -
 85
85 -
86
-
87
-
88
-
89
-
90
-
91
-
92
 |
 |

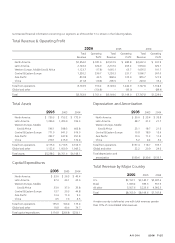
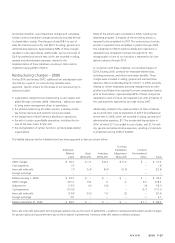
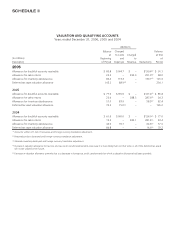
Summarized financial information concerning our segments as of December 31 is shown in the following tables.
Total Revenue & Operating Profit
2006 2005 2004
Total
Revenue
Operating
Profit
Total
Revenue
Operating
Profit
Total
Revenue
Operating
Profit
North America $2,554.0 $ 181.6 $2,510.5 $ 282.8 $2,632.3 $ 331.9
Latin America 2,743.4 424.0 2,272.6 453.2 1,934.6 420.7
Western Europe, Middle East & Africa 1,123.7 (17.8) 1,065.1 63.7 1,035.5 101.7
Central & Eastern Europe 1,320.2 296.7 1,226.3 331.7 1,066.7 307.0
Asia Pacific 810.8 42.5 868.6 102.9 855.7 121.9
China 211.8 (10.8) 206.5 7.7 223.0 35.2
Total from operations 8,763.9 916.2 8,149.6 1,242.0 7,747.8 1,318.4
Global and other – (154.8) – (93.0) – (89.4)
Total $8,763.9 $ 761.4 $8,149.6 $1,149.0 $7,747.8 $1,229.0
Total Assets
2006 2005 2004
North America $ 739.3 $ 753.2 $ 772.6
Latin America 1,396.4 1,204.9 726.4
Western Europe, Middle
East & Africa 546.1 548.3 466.8
Central & Eastern Europe 771.0 641.3 616.9
Asia Pacific 392.7 347.8 351.8
China 270.1 215.0 170.4
Total from operations 4,115.6 3,710.5 3,104.9
Global and other 1,122.6 1,050.9 1,043.2
Total assets $5,238.2 $4,761.4 $4,148.1
Capital Expenditures
2006 2005 2004
North America $ 33.0 $ 36.5 $ 40.4
Latin America 57.4 43.1 42.6
Western Europe, Middle
East & Africa 33.0 37.0 33.8
Central & Eastern Europe 13.7 30.3 44.8
Asia Pacific 13.4 11.9 9.3
China 4.5 7.6 4.5
Total from operations 155.0 166.4 175.4
Global and other 19.8 40.4 74.7
Total capital expenditures $174.8 $206.8 $250.1
Depreciation and Amortization
2006 2005 2004
North America $ 30.0 $ 35.4 $ 35.8
Latin America 48.7 31.2 21.7
Western Europe, Middle
East & Africa 23.1 18.7 21.6
Central & Eastern Europe 19.8 18.0 15.6
Asia Pacific 10.6 11.2 11.4
China 5.2 4.2 3.0
Total from operations $137.4 118.7 109.1
Global and other 22.2 20.9 24.6
Total depreciation and
amortization $159.6 $139.6 $133.7
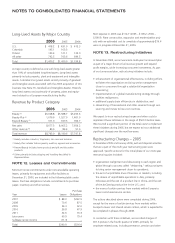
Total Revenue by Major Country
2006 2005 2004
U.S. $2,157.1 $2,140.7 $2,287.6
Brazil 1,039.2 785.3 557.9
All other 5,567.6 5,223.6 4,902.3
Total $8,763.9 $8,149.6 $7,747.8
A major country is defined as one with total revenues greater
than 10% of consolidated total revenues.
A V O N 2006 F-25