Avon 2006 Annual Report Download - page 30
Download and view the complete annual report
Please find page 30 of the 2006 Avon annual report below. You can navigate through the pages in the report by either clicking on the pages listed below, or by using the keyword search tool below to find specific information within the annual report.-
 1
1 -
2
-
3
-
4
-
5
-
6
-
7
-
8
-
9
-
10
-
11
-
12
-
13
-
14
-
15
-
16
-
17
-
18
-
19
-
 20
20 -
 21
21 -
 22
22 -
 23
23 -
 24
24 -
 25
25 -
 26
26 -
 27
27 -
 28
28 -
 29
29 -
 30
30 -
 31
31 -
 32
32 -
 33
33 -
 34
34 -
 35
35 -
 36
36 -
 37
37 -
 38
38 -
 39
39 -
 40
40 -
41
-
42
-
43
-
44
-
45
-
46
-
47
-
48
-
49
-
50
-
51
-
52
-
53
-
54
-
55
-
56
-
57
-
58
-
59
-
60
-
61
-
62
-
63
-
64
-
65
-
66
-
67
-
68
-
69
-
70
-
71
-
72
-
73
-
74
-
75
-
76
-
77
-
78
-
79
-
80
-
81
-
82
-
83
-
84
-
85
-
86
-
87
-
88
-
89
-
90
-
91
-
92
 |
 |
PART II
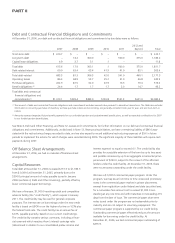
Total Revenue
Total revenue increased 8% in 2006. We continued to benefit
from the fourth quarter 2005 acquisition of our licensee in
Colombia, as that market contributed 3 percentage points to
revenue growth. Foreign exchange also contributed 2 percent-
age points to the revenue growth. Revenue grew in Latin Amer-
ica, Western Europe, Middle East & Africa, Central & Eastern
Europe, North America and China. Revenue declined in Asia
Pacific.
On a category basis, the 2006 increase in revenue was primarily
driven by an increase of 8% in Beauty sales. Within the Beauty
category, fragrance increased 12%, skin care increased 6%,
personal care increased 7% and color increased 3%. Beauty Plus
sales increased 10% and Beyond Beauty sales increased 2%.
Total revenue grew by 5% in 2005, with foreign exchange con-
tributing 3 percentage points to revenue growth. During 2005,
revenue grew in Latin America, Western Europe, Middle East &
Africa, and Central & Eastern Europe, while revenue declined in
North America and China.
On a category basis, the 2005 increase in revenue was driven by
increases in Beauty sales of 6% and Beauty Plus sales of 9% and
a decrease in Beyond Beauty sales of 5%.
For additional discussion of the changes in revenue by segment,
see the “Segment Review” section of this Management’s Dis-
cussion and Analysis of Financial Condition and Results of Oper-
ations.
Gross Margin
Gross margin decreased .7 point during 2006, primarily due to
higher inventory obsolescence provisions, which increased $89.4
in 2006. As discussed in the Overview section, 2006 includes
charges related to our new PLS program and our decision to
discontinue the sale of heavily discounted excess products.
Depending on the results of additional PLS analyses that will be
performed and timing of any resulting decisions, we expect to
incur future additional obsolescence charges.
Gross margin decreased .7 point in 2005, as compared to 2004,
due to unfavorable product mix, pricing and higher inventory
obsolescence expense. Gross margin during 2005 included $8.4
for inventory write-offs related to our restructuring initiatives.
Selling, General and Administrative
Expenses
Selling, general and administrative expenses increased $701.0
during 2006, primarily due to $181.0 of incremental costs
incurred to implement our restructuring initiatives and higher
spending on advertising of $113.0. Other contributing items
include higher performance-based compensation expense;
expenses associated with our business in Colombia, which was
acquired during the fourth quarter of 2005; a one-time charge
of $21.0 related to the resolution of a long-standing dispute
regarding value-added taxes in the U.K.; and additional expense
of $49.2 due to the adoption of SFAS 123R, including restricted
stock units granted in connection with design changes to share-
based compensation plans related to the adoption. These
expense increases were partially offset by benefits associated
with our restructuring initiatives, primarily salary and benefit
savings associated with our delayering initiative.
Selling, general and administrative expenses increased $280.6 in
2005, as compared to 2004, primarily due to $48.1 of costs
incurred to implement our restructuring initiatives, higher spend-
ing on brochures and our sales leadership program, higher pen-
sion expense, as well as the impact of higher revenue.
See the “Segment Review” section of Management’s Discussion
and Analysis of Financial Condition and Results of Operations for
additional information related to changes in operating margin by
segment.
Other Expenses
Interest expense increased in 2006 and 2005, mainly due to
higher borrowings to support our share repurchase programs, as
well as increases in domestic interest rates. At December 31,
2006 and 2005, we held interest rate swap agreements that
effectively converted approximately 30% and 60%, respectively,
of our outstanding long-term, fixed-rate borrowings to a variable
interest rate based on LIBOR. Our total exposure to floating
interest rates at December 31, 2006 was approximately 50%.
Interest income increased in both 2006 and 2005, primarily due
to higher cash and cash equivalent balances invested offshore at
higher interest rates.
Other expense, net increased in 2006, primarily because 2005
included a net gain of $4.7 million on the sale of investments in
equity securities and a gain of $2.5 on a treasury lock agreement
that was no longer designated as a hedge. Other expense, net
decreased in 2005, primarily because 2004 included write-
downs of $13.7 resulting from other-than-temporary declines in
the fair values of investments in equity securities below their
costs bases, as well as the gains included in 2005 discussed
above.
Effective Tax Rate
The effective tax rate for 2006 was 31.8%, compared to 24.0%
for 2005. During 2006, the tax rate was favorably impacted by