Avon 2006 Annual Report Download - page 74
Download and view the complete annual report
Please find page 74 of the 2006 Avon annual report below. You can navigate through the pages in the report by either clicking on the pages listed below, or by using the keyword search tool below to find specific information within the annual report.-
 1
1 -
2
-
3
-
4
-
5
-
6
-
7
-
8
-
9
-
10
-
11
-
12
-
13
-
14
-
15
-
16
-
17
-
18
-
19
-
20
-
21
-
22
-
23
-
24
-
25
-
26
-
27
-
28
-
29
-
30
-
31
-
32
-
33
-
34
-
35
-
36
-
37
-
38
-
39
-
40
-
41
-
42
-
43
-
44
-
45
-
46
-
47
-
48
-
49
-
50
-
51
-
52
-
53
-
54
-
55
-
56
-
57
-
58
-
59
-
60
-
61
-
62
-
63
-
 64
64 -
 65
65 -
 66
66 -
 67
67 -
 68
68 -
 69
69 -
 70
70 -
 71
71 -
 72
72 -
 73
73 -
 74
74 -
 75
75 -
 76
76 -
 77
77 -
 78
78 -
 79
79 -
 80
80 -
 81
81 -
 82
82 -
 83
83 -
 84
84 -
85
-
86
-
87
-
88
-
89
-
90
-
91
-
92
 |
 |

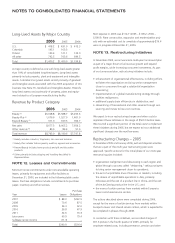
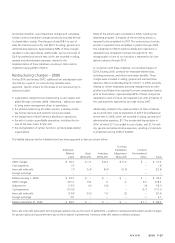
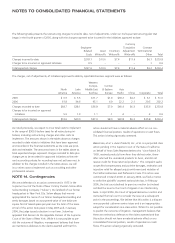
NOTES TO CONSOLIDATED FINANCIAL STATEMENTS
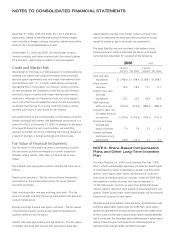
We also maintain a Supplemental Life Insurance Plan (“SLIP”)
under which additional death benefits ranging from $.4 to $2.0
are provided to certain active and retired officers.
We established a grantor trust to provide assets that may be
used for the benefits payable under the SERP, Restoration Plan
and SLIP and for obligations under the Plan. The trust is irrev-
ocable and, although subject to creditors’ claims, assets con-
tributed to the trust can only be used to pay such benefits with
certain exceptions. The assets held in the trust are included in
other assets and at December 31 consisted of the following:
2006 2005
Fixed-income portfolio $15.6 $14.9
Corporate-owned life insurance
policies 36.1 34.1
Cash and cash equivalents 25.2 34.4
Total $76.9 $83.4
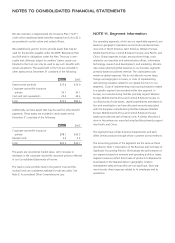
Additionally, we have assets that may be used for other benefit
payments. These assets are included in other assets and at
December 31 consisted of the following:
2006 2005
Corporate-owned life insurance
policies $58.1 $43.5
Mutual funds 2.4 2.2
Total $60.5 $45.7
The assets are recorded at market value, with increases or
decreases in the corporate-owned life insurance policies reflected
in our Consolidated Statements of Income.
The fixed-income portfolio held in the grantor trust and the
mutual funds are considered available-for-sale securities. See
Note 5, Accumulated Other Comprehensive Loss.
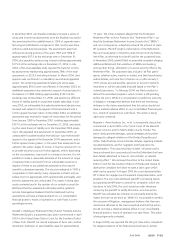
NOTE 11. Segment Information
Our operating segments, which are our reportable segments, are
based on geographic operations and include commercial busi-
ness units in North America; Latin America; Western Europe,
Middle East & Africa; Central & Eastern Europe; Asia Pacific; and
China. Global expenses include, among other things, costs
related to our executive and administrative offices, information
technology, research and development, and marketing. We allo-
cate certain planned global expenses to our business segments
primarily based on planned revenue. The unallocated costs
remain as global expenses. We do not allocate income taxes,
foreign exchange gains or losses, or costs of implementing
restructuring initiatives related to our global functions to our
segments. Costs of implementing restructuring initiatives related
to a specific segment are recorded within that segment. In
Europe, our manufacturing facilities primarily support Western
Europe, Middle East & Africa and Central & Eastern Europe. In
our disclosures of total assets, capital expenditures and deprecia-
tion and amortization, we have allocated amounts associated
with the European manufacturing facilities between Western
Europe, Middle East & Africa and Central & Eastern Europe
based upon planned sale of beauty units. A similar allocation is
done in Asia where our manufacturing facilities primarily support
Asia Pacific and China.
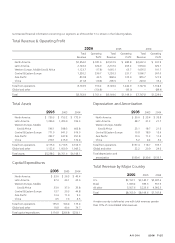
The segments have similar business characteristics and each
offers similar products through similar customer access methods.
The accounting policies of the segments are the same as those
described in Note 1, Description of the Business and Summary of
Significant Accounting Policies. We evaluate the performance of
our segments based on revenues and operating profits or losses.
Segment revenues reflect direct sales of products to Representa-
tives based on the Representative’s geographic location.
Intersegment sales and transfers are not significant. Each seg-
ment records direct expenses related to its employees and its
operations.