Avon 2006 Annual Report Download - page 34
Download and view the complete annual report
Please find page 34 of the 2006 Avon annual report below. You can navigate through the pages in the report by either clicking on the pages listed below, or by using the keyword search tool below to find specific information within the annual report.-
 1
1 -
2
-
3
-
4
-
5
-
6
-
7
-
8
-
9
-
10
-
11
-
12
-
13
-
14
-
15
-
16
-
17
-
18
-
19
-
20
-
21
-
22
-
23
-
 24
24 -
 25
25 -
 26
26 -
 27
27 -
 28
28 -
 29
29 -
 30
30 -
 31
31 -
 32
32 -
 33
33 -
 34
34 -
 35
35 -
 36
36 -
 37
37 -
 38
38 -
 39
39 -
 40
40 -
 41
41 -
 42
42 -
 43
43 -
 44
44 -
45
-
46
-
47
-
48
-
49
-
50
-
51
-
52
-
53
-
54
-
55
-
56
-
57
-
58
-
59
-
60
-
61
-
62
-
63
-
64
-
65
-
66
-
67
-
68
-
69
-
70
-
71
-
72
-
73
-
74
-
75
-
76
-
77
-
78
-
79
-
80
-
81
-
82
-
83
-
84
-
85
-
86
-
87
-
88
-
89
-
90
-
91
-
92
 |
 |

PART II
3%, reflecting strong Beauty growth driven by successful new
product launches and increased advertising.
Incremental costs, during 2006, associated with implementing
restructuring initiatives, primarily costs related to delayering,
drove the operating margin decline, and negatively impacted
segment operating margin 3.0 points in 2006. Other con-
tributing items include $21.0 of expense associated with the
resolution of a value-added tax dispute in the U.K in the third
quarter of 2006; incremental inventory obsolescence expense
related to our inventory initiatives; unfavorable foreign exchange
on imported inventory in Turkey; spending on advertising; higher
allocation of global expenses; and costs related to the
implementation of an enterprise resource planning system. These
unfavorable year-over-year comparisons were partially offset by
the impact of higher revenue and benefits associated with
restructuring initiatives, primarily compensation-related savings
associated with our delayering initiative.
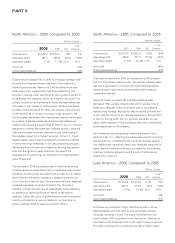
Western Europe, Middle East & Africa –
2005 Compared to 2004
%/Point Change
2005 2004 US$
Local
Currency
Total revenue $1,065.1 $1,035.5 3% 3%
Operating profit 63.7 101.7 (37)% (37)%
Operating margin 6.0% 9.8% (3.8) (3.8)
Units sold 4%
Active Representatives 5%
Total revenue increased in 2005 reflecting growth in Active
Representatives and units sold, as well as favorable foreign
exchange. Turkey continued to grow revenues, driven by high
growth in both Active Representatives and units sold. Revenue
decreased in the U.K. due to a smaller average order per Active
Representative, reflecting an economy adversely impacted by
higher interest rates, rising fuel costs and lower disposable
income, as well as increased competition.
Operating margin declined due to unfavorable pricing and prod-
uct mix, higher manufacturing overhead, costs associated with
planning and developing an enterprise resource planning system,
and costs to implement restructuring initiatives. Operating mar-
gin during 2005 also suffered from investment in overhead and
expenses to support an expectation of growth that did not
materialize.
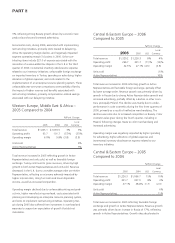
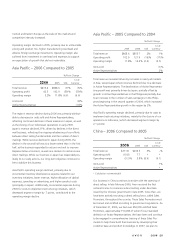
Central & Eastern Europe – 2006
Compared to 2005
%/Point Change
2006 2005 US$
Local
Currency
Total revenue $1,320.2 $1,226.3 8% 4%
Operating profit 296.7 331.7 (11)% (14)%
Operating margin 22.5% 27.1% (4.6) (4.8)
Units sold (1)%
Active Representatives 10%
Total revenue increased in 2006 reflecting growth in Active
Representatives and favorable foreign exchange, partially offset
by lower average order. Revenue growth was primarily driven by
growth in Russia due to strong Active Representative growth and
increased advertising, partially offset by a decline in other coun-
tries, principally Poland. This decline was mainly due to under-
performance in color cosmetics during the first three quarters of
2006, primarily as a result of ineffective merchandising. The
declines were also due to increased competition in Beauty. Color
cosmetics sales grew during the fourth quarter, including in
Poland, following changes made to color merchandising and
increased advertising.
Operating margin was negatively impacted by higher spending
for advertising, higher allocation of global expenses and
incremental inventory obsolescence expense related to our
inventory initiatives.
Central & Eastern Europe – 2005
Compared to 2004
%/Point Change
2005 2004 US$
Local
Currency
Total revenue $1,226.3 $1,066.7 15% 10%
Operating profit 331.7 307.0 8% 3%
Operating margin 27.1% 28.8% (1.7) (2.0)
Units sold 6%
Active Representatives 11%
Total revenue increased in 2005 reflecting favorable foreign
exchange and growth in Active Representatives. Revenue growth
was primarily driven by an increase in Russia of 17%, reflecting
growth in Active Representatives. Growth rates decelerated in