Avon 2006 Annual Report Download - page 29
Download and view the complete annual report
Please find page 29 of the 2006 Avon annual report below. You can navigate through the pages in the report by either clicking on the pages listed below, or by using the keyword search tool below to find specific information within the annual report.-
 1
1 -
2
-
3
-
4
-
5
-
6
-
7
-
8
-
9
-
10
-
11
-
12
-
13
-
14
-
15
-
16
-
17
-
18
-
 19
19 -
 20
20 -
 21
21 -
 22
22 -
 23
23 -
 24
24 -
 25
25 -
 26
26 -
 27
27 -
 28
28 -
 29
29 -
 30
30 -
 31
31 -
 32
32 -
 33
33 -
 34
34 -
 35
35 -
 36
36 -
 37
37 -
 38
38 -
 39
39 -
40
-
41
-
42
-
43
-
44
-
45
-
46
-
47
-
48
-
49
-
50
-
51
-
52
-
53
-
54
-
55
-
56
-
57
-
58
-
59
-
60
-
61
-
62
-
63
-
64
-
65
-
66
-
67
-
68
-
69
-
70
-
71
-
72
-
73
-
74
-
75
-
76
-
77
-
78
-
79
-
80
-
81
-
82
-
83
-
84
-
85
-
86
-
87
-
88
-
89
-
90
-
91
-
92
 |
 |

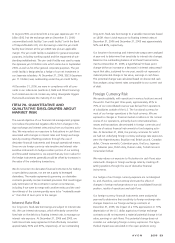
Taxes
We record a valuation allowance to reduce our deferred tax
assets to an amount that is more likely than not to be realized.
While we have considered projected future taxable income and
ongoing tax planning strategies in assessing the need for the
valuation allowance, in the event we were to determine that we
would be able to realize a net deferred tax asset in the future, in
excess of the net recorded amount, an adjustment to the
deferred tax asset would increase earnings in the period such
determination was made. Likewise, should we determine that
we would not be able to realize all or part of our net deferred
tax asset in the future, an adjustment to the deferred tax asset
would decrease earnings in the period such determination was
made. We establish additional provisions for income taxes when,
despite the belief that our tax positions are fully supportable,
there remain certain positions that are likely to be challenged
and may or may not be sustained on review by tax authorities.
We adjust these additional accruals in light of changing facts
and circumstances. We file income tax returns in many juris-
dictions. In 2007, a number of income tax returns are scheduled
to close by statute and it is possible that a number of tax exami-
nations may be completed. If Avon’s filing positions are ulti-
mately upheld, it is possible that the 2007 provision for income
taxes may reflect adjustments. Depending on the number of fil-
ing positions ultimately upheld, the impact of the adjustments
could be significant to 2007 net income.
Share-based Compensation
Effective January 1, 2006, we adopted SFAS No. 123R, which
requires all share-based payments to employees to be recognized
in the financial statements based on their fair values using an
option-pricing model at the date of grant. We use a Black-
Scholes-Merton option-pricing model to calculate the fair value
of options. This model requires various judgmental assumptions
including volatility, forfeiture rates and expected option life. If
any of the assumptions used in the model change significantly,
share-based compensation may differ materially in the future
from that recorded in the current period.
Loss Contingencies
In accordance with FAS No. 5, Accounting for Contingencies,we
determine whether to disclose and accrue for loss contingencies
based on an assessment of whether the risk of loss is remote,
reasonably possible or probable. Our assessment is developed in
consultation with our outside counsel and other advisors and is
based on an analysis of possible outcomes under various strat-
egies. Loss contingency assumptions involve judgments that are
inherently subjective and can involve matters that are in liti-
gation, which, by its nature is unpredictable. We believe that our
assessment of the probability of loss contingencies is reasonable,
but because of the subjectivity involved and the unpredictable
nature of the subject matter at issue, our assessment may prove
ultimately to be incorrect, which could materially impact the
Consolidated Financial Statements.
RESULTS OF OPERATIONS – CONSOLIDATED
Favorable (Unfavorable)
%/Point Change
2006 2005 2004
2006 vs.
2005
2005 vs.
2004
Total revenue $8,763.9 $8,149.6 $7,747.8 8% 5%
Cost of sales 3,434.6 3,133.7 2,932.5 (10)% (7)%
Selling, general and administrative expenses 4,567.9 3,866.9 3,586.3 (18)% (8)%
Advertising expenses (1) 248.9 135.9 127.6 (83)% (7)%
Operating profit 761.4 1,149.0 1,229.0 (34)% (7)%
Interest expense 99.6 54.1 33.8 (84)% (60)%
Interest income 55.3 37.3 20.6 48% 81%
Other expense, net 13.6 8.0 28.3 (70)% 72%
Net income 477.6 847.6 846.1 (44)% –%
Diluted earnings per share 1.06 1.81 1.77 (41)% 2%
Gross margin 60.8% 61.5% 62.2% (.7) (.7)
Selling, general and administrative expenses as a % of
total revenue 52.1% 47.4% 46.3% (4.7) (1.1)
Operating margin 8.7% 14.1% 15.9% (5.4) (1.8)
Effective tax rate 31.8% 24.0% 27.8% (7.8) 3.8
Units sold 2% 3%
Active Representatives 5% 6%
(1) Advertising expenses are included within selling, general and administrative expenses.
A V O N 2006 23