Avon 2006 Annual Report Download - page 36
Download and view the complete annual report
Please find page 36 of the 2006 Avon annual report below. You can navigate through the pages in the report by either clicking on the pages listed below, or by using the keyword search tool below to find specific information within the annual report.-
 1
1 -
2
-
3
-
4
-
5
-
6
-
7
-
8
-
9
-
10
-
11
-
12
-
13
-
14
-
15
-
16
-
17
-
18
-
19
-
20
-
21
-
22
-
23
-
24
-
25
-
 26
26 -
 27
27 -
 28
28 -
 29
29 -
 30
30 -
 31
31 -
 32
32 -
 33
33 -
 34
34 -
 35
35 -
 36
36 -
 37
37 -
 38
38 -
 39
39 -
 40
40 -
 41
41 -
 42
42 -
 43
43 -
 44
44 -
 45
45 -
 46
46 -
47
-
48
-
49
-
50
-
51
-
52
-
53
-
54
-
55
-
56
-
57
-
58
-
59
-
60
-
61
-
62
-
63
-
64
-
65
-
66
-
67
-
68
-
69
-
70
-
71
-
72
-
73
-
74
-
75
-
76
-
77
-
78
-
79
-
80
-
81
-
82
-
83
-
84
-
85
-
86
-
87
-
88
-
89
-
90
-
91
-
92
 |
 |

PART II
initiate a removal program, consistent with removal programs in
our other markets, to eliminate inactive certified Sales Promoters
after a period of time. Since we received our license, other
companies have received direct selling licenses, with two large
multi-national competitors receiving regional licenses in late
2006.
Prior to the reopening of direct selling we had sold our products
in China through a network of licensed beauty boutiques, as
well as dealer-owned and company-owned store counters. The
company-owned store counters were exited as part of our
restructuring initiatives. In addition to being a retail boutique, a
beauty boutique can now participate in direct selling by operat-
ing as a service center to the Sales Promoters, an essential ele-
ment of the direct selling model stipulated in the Direct Selling
regulations, for which they can earn service fees from Avon.
China’s revenue is now generated through Sales Promoters,
beauty boutiques and dealer-owned counters.
Total revenue increased in 2006, as significant growth in direct
selling more than offset the lower revenue from beauty bou-
tiques, as they reduced their order sizes in connection with the
resumption of direct selling, as well as the unfavorable impact of
the exit of company-owned counters, which had a negative
nine-point impact on 2006 revenue growth. Total revenue in
2006 also benefited from the favorable effects of foreign
exchange. Due to the significant growth of direct selling since
our March 2006 launch, direct selling is becoming a greater por-
tion of our business and is expected to continue as it is built up.
At the same time that we have been building on direct selling,
we have stabilized our beauty boutiques. During 2006, we have
not experienced a significant decline in the number of beauty
boutiques, and we ended 2006 with a similar number of active
beauty boutiques as compared to the beginning of 2006.
The operating margin decrease was primarily driven by sig-
nificantly higher spending on advertising, fees paid to registered
service centers for providing services to our Active Representa-
tives, and other costs associated with the launch of direct selling.
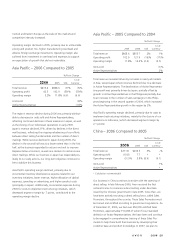
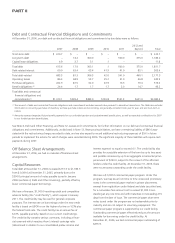
China – 2005 Compared to 2004
%/Point Change
2005 2004 US$
Local
Currency
Total revenue $206.5 $223.0 (7)% (8)%
Operating profit 7.7 35.2 (78)% (78)%
Operating margin 3.8% 15.8% (12.0) (12.0)
Units sold (3)%
Active Representatives *
* Calculation not meaningful
Revenue in China declined 7% as the beauty boutique owners
reduced the size of their orders as compared to the prior year in
connection with the anticipated resumption of direct selling
discussed above.
Operating margin decreased driven by incremental costs to
prepare for direct selling and the cost of maintaining our
consumer investment, primarily through advertising, against a
significantly lower revenue base.
LIQUIDITY AND CAPITAL RESOURCES
Our principal sources of funds historically have been cash flows
from operations, commercial paper and borrowings under lines
of credit. We currently believe that existing cash, cash from
operations (including the impacts of cash required for restructur-
ing initiatives) and available sources of public and private financ-
ing are adequate to meet anticipated requirements for working
capital, dividends, capital expenditures, the stock repurchase
program, possible acquisitions and other cash needs.
Balance Sheet Data
2006 2005
Cash and cash equivalents $1,198.9 $1,058.7
Total debt 1,786.3 1,649.0
Working capital 784.2 419.3
Cash Flows
2006 2005 2004
Net cash provided by
operating activities $ 796.1 $ 895.5 $ 882.6
Net cash used by investing
activities (207.9) (343.1) (279.4)
Net cash used by financing
activities (490.4) (226.7) (567.0)
Effect of exchange rate
changes on cash and
equivalents 42.4 (36.6) 39.4
Net Cash Provided by Operating Activities
Net cash provided by operating activities decreased by $99.4
during 2006, primarily due to cash payments of approximately
$117.0 associated with restructuring charges, and additional
cash payments associated with other costs to implement
restructuring initiatives. To a lesser extent, unfavorable working
capital levels in inventory and accounts receivable contributed to
the decrease in net cash provided by operating activities. These
decreases in operating cash flow were partially offset by