Avon 2006 Annual Report Download - page 31
Download and view the complete annual report
Please find page 31 of the 2006 Avon annual report below. You can navigate through the pages in the report by either clicking on the pages listed below, or by using the keyword search tool below to find specific information within the annual report.-
 1
1 -
2
-
3
-
4
-
5
-
6
-
7
-
8
-
9
-
10
-
11
-
12
-
13
-
14
-
15
-
16
-
17
-
18
-
19
-
20
-
 21
21 -
 22
22 -
 23
23 -
 24
24 -
 25
25 -
 26
26 -
 27
27 -
 28
28 -
 29
29 -
 30
30 -
 31
31 -
 32
32 -
 33
33 -
 34
34 -
 35
35 -
 36
36 -
 37
37 -
 38
38 -
 39
39 -
 40
40 -
 41
41 -
42
-
43
-
44
-
45
-
46
-
47
-
48
-
49
-
50
-
51
-
52
-
53
-
54
-
55
-
56
-
57
-
58
-
59
-
60
-
61
-
62
-
63
-
64
-
65
-
66
-
67
-
68
-
69
-
70
-
71
-
72
-
73
-
74
-
75
-
76
-
77
-
78
-
79
-
80
-
81
-
82
-
83
-
84
-
85
-
86
-
87
-
88
-
89
-
90
-
91
-
92
 |
 |

approximately 4.0 points due to the closure of tax years by
expiration of the statute of limitations and audit settlements as
well as 1.7 points due to tax refunds. These benefits were parti-
ally offset by the repatriation of international earnings, which
increased the rate by approximately 3.1 points, and the tax
impact associated with our restructuring charges due to the
lower weighted-average effective tax rate of subsidiaries incur-
ring the charges.
The effective tax rate for 2005 was 24.0%, primarily due to the
favorable effects of the completion of tax examinations, as well
as the closure of a tax year by expiration of the statute of limi-
tations, which reduced the effective tax rate by approximately
10.5 points.
SEGMENT REVIEW
Below is an analysis of the key factors affecting revenue and operating profit by reportable segment for each of the years in the three-year
period ended December 31, 2006.
Years ended December 31 2006 2005 2004
Total
Revenue
Operating
Profit
Total
Revenue
Operating
Profit
Total
Revenue
Operating
Profit
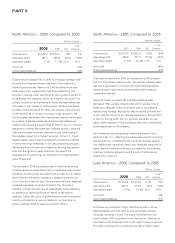
North America $2,554.0 $ 181.6 $2,510.5 $ 282.8 $2,632.3 $ 331.9
Latin America 2,743.4 424.0 2,272.6 453.2 1,934.6 420.7
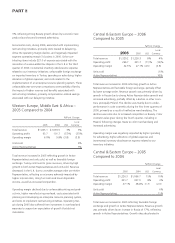
Western Europe, Middle East &
Africa 1,123.7 (17.8) 1,065.1 63.7 1,035.5 101.7
Central & Eastern Europe 1,320.2 296.7 1,226.3 331.7 1,066.7 307.0
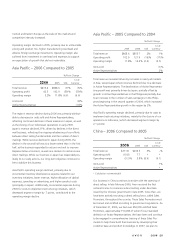
Asia Pacific 810.8 42.5 868.6 102.9 855.7 121.9
China 211.8 (10.8) 206.5 7.7 223.0 35.2
Total from operations 8,763.9 916.2 8,149.6 1,242.0 7,747.8 1,318.4
Global and other expenses – (154.8) – (93.0) – (89.4)
Total $8,763.9 $ 761.4 $8,149.6 $1,149.0 $7,747.8 $1,229.0
Global and other expenses include, among other things, costs
related to our executive and administrative offices, information
technology, research and development, and marketing. Certain
planned global expenses are allocated to our business segments
primarily based on planned revenue. The unallocated costs
remain as global and other expenses. We do not allocate costs of
implementing restructuring initiatives related to our global func-
tions to our segments. Costs of implementing restructuring ini-
tiatives related to a specific segment are recorded within that
segment.
2006 2005 % Change 2005 2004 % Change
Total Global expenses $ 463.6 $ 320.8 (45)% $ 320.8 $ 325.9 2%
Allocated to segments (308.8) (227.8) 36% (227.8) (236.5) (4)%
Net Global expenses $ 154.8 $ 93.0 (66)% $ 93.0 $ 89.4 (4)%
The increase in the amounts allocated to the segments in 2006
was primarily due to higher share-based compensation expense
due to our adoption of FAS 123R effective January 1, 2006, as
well as higher performance-based compensation expense. The
increase in net global expenses was primarily due to incremental
costs of $42.4 to implement restructuring initiatives, as well as
higher than planned performance-based compensation expense.
Net global expenses increased in 2005, primarily due to costs to
implement restructuring initiatives, partially offset by lower
expense for performance-based compensation plans.
A V O N 2006 25