Avon 2006 Annual Report Download - page 32
Download and view the complete annual report
Please find page 32 of the 2006 Avon annual report below. You can navigate through the pages in the report by either clicking on the pages listed below, or by using the keyword search tool below to find specific information within the annual report.-
 1
1 -
2
-
3
-
4
-
5
-
6
-
7
-
8
-
9
-
10
-
11
-
12
-
13
-
14
-
15
-
16
-
17
-
18
-
19
-
20
-
21
-
 22
22 -
 23
23 -
 24
24 -
 25
25 -
 26
26 -
 27
27 -
 28
28 -
 29
29 -
 30
30 -
 31
31 -
 32
32 -
 33
33 -
 34
34 -
 35
35 -
 36
36 -
 37
37 -
 38
38 -
 39
39 -
 40
40 -
 41
41 -
 42
42 -
43
-
44
-
45
-
46
-
47
-
48
-
49
-
50
-
51
-
52
-
53
-
54
-
55
-
56
-
57
-
58
-
59
-
60
-
61
-
62
-
63
-
64
-
65
-
66
-
67
-
68
-
69
-
70
-
71
-
72
-
73
-
74
-
75
-
76
-
77
-
78
-
79
-
80
-
81
-
82
-
83
-
84
-
85
-
86
-
87
-
88
-
89
-
90
-
91
-
92
 |
 |

PART II
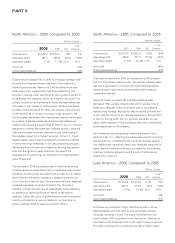
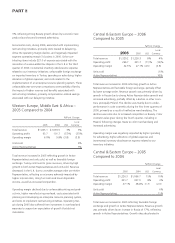
North America – 2006 Compared to 2005
%/Point Change
2006 2005 US$
Local
Currency
Total revenue $2,554.0 $2,510.5 2% 1%
Operating profit 181.6 282.8 (36)% (36)%
Operating margin 7.1% 11.3% (4.2) (4.2)
Units sold (4)%
Active Representatives (3)%
Total revenue increased 2% in 2006, as the larger average order
received from Representatives more than offset a decline in
Active Representatives. Revenue in 2006 benefited from new
product launches, supported by significant advertising. The
increase in average order was driven by strong sales of products
in the Beauty Plus category, which has a higher price point. The
primary contributor to the decline in Active Representatives was
a decrease in the number of orders placed. While Active Repre-
sentatives declined overall for 2006, we noted an improvement
in the second half of the year, turning to slight growth in the
fourth quarter. We believe this improvement was primarily driven
by a variety of Representative value-enhancing initiatives we
implemented during the second half of 2006 in our U.S. business
designed to increase Representative ordering activity, combined
with our increased consumer investments and some easing in
the negative impact from higher fuel prices. In the U.S., these
Representative value enhancing initiatives included re-indexing
of certain earnings thresholds in our Sales Leadership program,
distributing bonus brochures to higher-performing Representa-
tives and strengthening sales incentives. We expect this
improvement to continue as we implement our Representative
Value Proposition.
The decrease in 2006 operating margin in North America was
primarily driven by incremental costs to implement restructuring
initiatives, including costs associated with our decision to realign
North America distribution operations, delayering and the clo-
sure of the Avon Salon & Spa. These incremental costs negatively
impacted operating margin by 2.2 points. The decrease in
operating margin was also due to substantially higher spending
on advertising, higher performance-based compensation
expenses, higher allocation of global expenses, and incremental
inventory obsolescence expense related to our inventory ini-
tiatives, partially offset by expense reduction efforts.
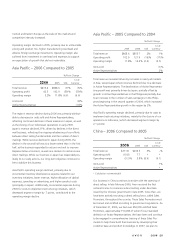
North America – 2005 Compared to 2004
%/Point Change
2005 2004 US$
Local
Currency
Total revenue $2,510.5 $2,632.3 (5)% (5)%
Operating profit 282.8 331.9 (15)% (16)%
Operating margin 11.3% 12.6% (1.3) (1.4)
Units sold (6)%
Active Representatives (3)%
Total revenue declined in 2005 as compared to 2004 primarily
due to a 7% decline in Beauty sales. The decline in Beauty sales
was due to decreases in units sold and Active Representatives,
reflecting lower customer purchase frequency and ongoing
competitive intensity.
Beauty Plus sales increased 9% and Beyond Beauty sales
decreased 14%, partially reflecting the shift in product mix in
these two categories which occurred as part of our planned
repositioning strategy. Beauty Plus sales increased primarily due
to the national roll-out of an intimate apparel line, during 2005,
in the U.S. During 2005, the U.S. business exited the toy cat-
egory, which was part of Beyond Beauty and which contributed
to decreased sales in this category.
North American operating margin declined primarily due to
declines in the U.S., reflecting the unfavorable impacts of pricing
and product mix, including the roll-out of the intimate apparel
line. Additionally, operating margin was negatively impacted by
lower revenue combined with costs to implement restructuring
initiatives, primarily delayering and the exit of the beComing
product line in the U.S.
Latin America – 2006 Compared to 2005
%/Point Change
2006 2005 US$
Local
Currency
Total revenue $2,743.4 $2,272.6 21% 17%
Operating profit 424.0 453.2 (6)% (10)%
Operating margin 15.5% 19.9% (4.4) (4.5)
Units sold 8%
Active Representatives 11%
Total revenue increased in 2006, reflecting growth in Active
Representatives and units sold, as well as favorable foreign
exchange, primarily in Brazil. The region benefited from the
fourth quarter 2005 acquisition of our licensee in Colombia, as
that market contributed 8 points to the region’s revenue growth.
The region benefited from continued strength in Brazil, where