Avon 2006 Annual Report Download - page 35
Download and view the complete annual report
Please find page 35 of the 2006 Avon annual report below. You can navigate through the pages in the report by either clicking on the pages listed below, or by using the keyword search tool below to find specific information within the annual report.-
 1
1 -
2
-
3
-
4
-
5
-
6
-
7
-
8
-
9
-
10
-
11
-
12
-
13
-
14
-
15
-
16
-
17
-
18
-
19
-
20
-
21
-
22
-
23
-
24
-
 25
25 -
 26
26 -
 27
27 -
 28
28 -
 29
29 -
 30
30 -
 31
31 -
 32
32 -
 33
33 -
 34
34 -
 35
35 -
 36
36 -
 37
37 -
 38
38 -
 39
39 -
 40
40 -
 41
41 -
 42
42 -
 43
43 -
 44
44 -
 45
45 -
46
-
47
-
48
-
49
-
50
-
51
-
52
-
53
-
54
-
55
-
56
-
57
-
58
-
59
-
60
-
61
-
62
-
63
-
64
-
65
-
66
-
67
-
68
-
69
-
70
-
71
-
72
-
73
-
74
-
75
-
76
-
77
-
78
-
79
-
80
-
81
-
82
-
83
-
84
-
85
-
86
-
87
-
88
-
89
-
90
-
91
-
92
 |
 |

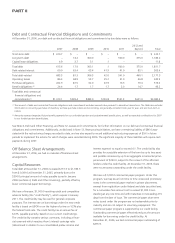
Central and Eastern Europe as the scale of the markets and
competitive intensity increased.
Operating margin declined in 2005, primarily due to unfavorable
pricing and product mix, higher manufacturing overhead and
adverse foreign exchange movements. Operating margin also
suffered from investment in overhead and expenses to support
an expectation of growth that did not materialize.
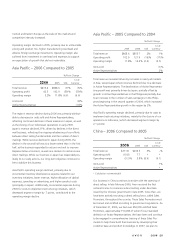
Asia Pacific – 2006 Compared to 2005
%/Point Change
2006 2005 US$
Local
Currency
Total revenue $810.8 $868.6 (7)% (6)%
Operating profit 42.5 102.9 (59)% (59)%
Operating margin 5.2% 11.8% (6.6) (6.6)
Units sold (9)%
Active Representatives (10)%
The region’s revenue decline during 2006 was primarily attribut-
able to decreases in units sold and Active Representatives,
reflecting continued declines in these measures in Japan, as well
as the closing of our Indonesian operations in early 2006.
Japan’s revenue declined 21%, driven by declines in the direct
mail business, reflecting the ongoing rebalancing of our efforts
between direct selling fundamentals and the number of direct
mailings. While revenue declined in Japan during 2006, the
decline in the second half was to a lesser extent than in the first
half, as the business responded to actions we took to improve
Representative economics, as well as a decision to restore some
direct mailings. While our business in Japan has responded pos-
itively to our early actions, our long-term objective continues to
be to stabilize this business.
Asia Pacific operating margin declined, primarily due to
incremental inventory obsolescence expense related to our
inventory initiatives, lower revenue, higher allocation of global
expenses, spending on advertising, and higher product costs
(principally in Japan). Additionally, incremental expenses during
2006 for costs to implement restructuring initiatives, which
decreased segment margin by .7 points, contributed to the
operating margin decline.
Asia Pacific – 2005 Compared to 2004
%/Point Change
2005 2004 US$
Local
Currency
Total revenue $868.6 $855.7 2% 1%
Operating profit 102.9 121.9 (16)% (17)%
Operating margin 11.8% 14.2% (2.4) (2.5)
Units sold (1)%
Active Representatives 2%
Total revenue increased driven by increases in nearly all markets
in Asia, except Japan where revenue declined due to a decrease
in Active Representatives. The deceleration of Active Representa-
tive growth was primarily driven by Japan, partially offset by
growth in Active Representatives in the Philippines partially due
to an increase in the number of sales campaigns in the Philip-
pines beginning in the second quarter of 2004, which increased
the Active Representative growth in the region by 2%.
Asia Pacific operating margin declined, primarily due to costs to
implement restructuring initiatives, mainly for the closure of our
operations in Indonesia, (which decreased segment margin by
2.1 points).
China – 2006 Compared to 2005
%/Point Change
2006 2005 US$
Local
Currency
Total revenue $211.8 $206.5 3% –%
Operating profit (10.8) 7.7 * *
Operating margin (5.1)% 3.8% (8.9) (9.1)
Units sold 1%
Active Representatives *
* Calculation not meaningful
Our business in China continues to evolve with the opening of
direct selling. In late February 2006, Avon received the first
national license to commence direct selling under directives
issued by the Chinese government in late 2005. Since then, we
have been actively recruiting a direct selling force, called Sales
Promoters, throughout the country. These Sales Promoters must
be trained and certified according to government regulations. As
of December 31, 2006, we had over 350,000 certified Sales
Promoters, approximately 150,000 of whom fit our standard
definition of Active Representatives. We have been and continue
to be engaged in comprehensive training of these Sales Pro-
moters to help them build their business by developing their
customer base and product knowledge. In 2007, we plan to
A V O N 2006 29