Avon 2006 Annual Report Download - page 71
Download and view the complete annual report
Please find page 71 of the 2006 Avon annual report below. You can navigate through the pages in the report by either clicking on the pages listed below, or by using the keyword search tool below to find specific information within the annual report.-
 1
1 -
2
-
3
-
4
-
5
-
6
-
7
-
8
-
9
-
10
-
11
-
12
-
13
-
14
-
15
-
16
-
17
-
18
-
19
-
20
-
21
-
22
-
23
-
24
-
25
-
26
-
27
-
28
-
29
-
30
-
31
-
32
-
33
-
34
-
35
-
36
-
37
-
38
-
39
-
40
-
41
-
42
-
43
-
44
-
45
-
46
-
47
-
48
-
49
-
50
-
51
-
52
-
53
-
54
-
55
-
56
-
57
-
58
-
59
-
60
-
 61
61 -
 62
62 -
 63
63 -
 64
64 -
 65
65 -
 66
66 -
 67
67 -
 68
68 -
 69
69 -
 70
70 -
 71
71 -
 72
72 -
 73
73 -
 74
74 -
 75
75 -
 76
76 -
 77
77 -
 78
78 -
 79
79 -
 80
80 -
 81
81 -
82
-
83
-
84
-
85
-
86
-
87
-
88
-
89
-
90
-
91
-
92
 |
 |

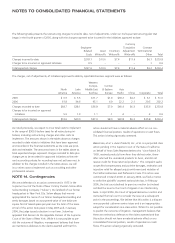
The U.S. pension plans include funded qualified plans and
unfunded non-qualified plans. As of December 31, 2006 and
2005, the U.S. qualified pension plans had benefit obligations of
$735.3 and $766.7, and plan assets of $738.8 and $693.0,
respectively. We believe we have adequate investments and cash
flows to fund the liabilities associated with the unfunded
non-qualified plans.
Components of Net Periodic Benefit Cost and Other Amounts Recognized in Other
Comprehensive Income
Pension Benefits
Postretirement BenefitsU.S. Plans Non-U.S. Plans
2006 2005 2004 2006 2005 2004 2006 2005 2004
Net Periodic Benefit Cost:
Service cost $ 25.8 $ 29.5 $ 25.5 $ 21.4 $ 20.3 $ 18.3 $ 3.4 $ 2.4 $ 2.5
Interest cost 48.4 48.9 48.1 34.2 33.0 32.3 10.5 9.2 11.5
Expected return on plan assets (54.5) (52.5) (51.5) (31.1) (28.0) (26.5) – – –
Amortization of prior service (credit) cost (2.2) (2.3) (.3) .2 1.6 1.4 (6.0) (6.1) (5.0)
Amortization of actuarial losses 33.1 38.6 30.5 11.5 9.5 6.3 1.9 2.2 1.7
Settlements/curtailments 11.2 – – 2.6 1.9 .3 (2.1) – –
Special termination benefits 6.3 .2 – .6 – – 3.3 – –
Other – – – (.2) (.7) .6 – – –
Net periodic benefit cost $ 68.1 $ 62.4 $ 52.3 $ 39.2 $ 37.6 $ 32.7 $11.0 $ 7.7 $10.7
The amounts in accumulated other comprehensive loss that are
expected to be recognized as components of net periodic benefit
cost during 2007 are as follows:
Pension Benefits
Postretirement
Benefits
U.S.
Plans
Non-U.S.
Plans
Net actuarial loss $32.4 $12.2 $ 1.9
Prior service credit (1.9) (1.7) (6.1)
Transition obligation – .1 –
In 2002 and 2001, the plan assets experienced weaker invest-
ment returns, which was mostly due to unfavorable returns on
equity securities. These unfavorable investment returns increased
pension costs in 2006, 2005 and 2004. In addition, net periodic
pension cost may significantly increase in the future if settlement
losses are required to be recorded due to an increase in the
aggregate benefits paid as lump sum distributions. Settlement
losses may result in the future if the number of eligible partic-
ipants deciding to receive lump sum distributions and the
amount of their benefits increases. Curtailment gains or losses
may result in the future if an event occurs that significantly
reduces the number of years of future service of current employ-
ees or eliminates the accrual of defined benefits for some or all
future services of a significant number of employees.
Assumptions
Weighted-average assumptions used to determine benefit obligations recorded on the Consolidated Balance Sheets as of December 31 were
as follows:
Pension Benefits
U.S. Plans Non-U.S. Plans Postretirement Benefits
2006 2005 2006 2005 2006 2005
Discount rate 5.90% 5.50% 4.93% 4.83% 5.90% 5.50%
Rate of compensation increase 5.00% 6.00% 3.05% 2.94% N/A N/A
A V O N 2006 F-21