Audi 2006 Annual Report Download - page 196
Download and view the complete annual report
Please find page 196 of the 2006 Audi annual report below. You can navigate through the pages in the report by either clicking on the pages listed below, or by using the keyword search tool below to find specific information within the annual report.-
 1
1 -
2
-
3
-
4
-
5
-
6
-
7
-
8
-
9
-
10
-
11
-
12
-
13
-
14
-
15
-
16
-
17
-
18
-
19
-
20
-
21
-
22
-
23
-
24
-
25
-
26
-
27
-
28
-
29
-
30
-
31
-
32
-
33
-
34
-
35
-
36
-
37
-
38
-
39
-
40
-
41
-
42
-
43
-
44
-
45
-
46
-
47
-
48
-
49
-
50
-
51
-
52
-
53
-
54
-
55
-
56
-
57
-
58
-
59
-
60
-
61
-
62
-
63
-
64
-
65
-
66
-
67
-
68
-
69
-
70
-
71
-
72
-
73
-
74
-
75
-
76
-
77
-
78
-
79
-
80
-
81
-
82
-
83
-
84
-
85
-
86
-
87
-
88
-
89
-
90
-
91
-
92
-
93
-
94
-
95
-
96
-
97
-
98
-
99
-
100
-
101
-
102
-
103
-
104
-
105
-
106
-
107
-
108
-
109
-
110
-
111
-
112
-
113
-
114
-
115
-
116
-
117
-
118
-
119
-
120
-
121
-
122
-
123
-
124
-
125
-
126
-
127
-
128
-
129
-
130
-
131
-
132
-
133
-
134
-
135
-
136
-
137
-
138
-
139
-
140
-
141
-
142
-
143
-
144
-
145
-
146
-
147
-
148
-
149
-
150
-
151
-
152
-
153
-
154
-
155
-
156
-
157
-
158
-
159
-
160
-
161
-
162
-
163
-
164
-
165
-
166
-
167
-
168
-
169
-
170
-
171
-
172
-
173
-
174
-
175
-
176
-
177
-
178
-
179
-
180
-
181
-
182
-
183
-
184
-
185
-
 186
186 -
 187
187 -
 188
188 -
 189
189 -
 190
190 -
 191
191 -
 192
192 -
 193
193 -
 194
194 -
 195
195 -
 196
196 -
 197
197 -
 198
198 -
 199
199 -
 200
200 -
 201
201 -
 202
202 -
 203
203 -
 204
204 -
 205
205 -
 206
206 -
207
-
208
-
209
-
210
-
211
-
212
 |
 |

1 9 4
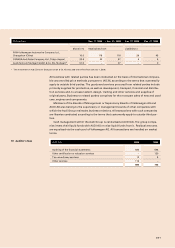
Actuarial gains and losses result from changes in the number of people participating in the
pension scheme and from a deviation in the actual trends (for example, increases in pay or
retirement benefit) from the figures assumed for calculation purposes. In accordance with
IAS 19, such gains and losses are recognised under a separate item within equity, after tak-
ing account of deferred tax.
The present value of defined benefit obligations changed as follows:
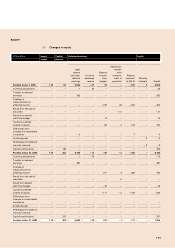
EUR million 2006 2005
Present value at January 1 2,418 2,016
Service cost 99 66
Interest cost 104 100
Actuarial losses – 279 334
Pension payments from company assets – 61 – 57
Pension payments from fund assets – – 1
Changes in consolidated companies – – 40
Currency differences – 1 –
Present value at December 31 2,280 2,418
The fund assets changed as follows:
EUR million 2006 2005
Fund assets at January 1 238 196
Expected net investment income 13 11
Actuarial gains 5 12
Employer contributions 50 50
Benefits paid 0 – 1
Changes in consolidated companies – – 30
Fund assets at December 31 306 238
Employer contributions totalling EUR 48 million are expected for the following financial
year.
The fund assets are made up as follows:
% of fund assets 2006 2005
Shares 39.8 40.5
Fixed-interest securities 51.3 52.2
Cash in hand 7.3 7.3
Other 1.5 –