Audi 2006 Annual Report Download - page 181
Download and view the complete annual report
Please find page 181 of the 2006 Audi annual report below. You can navigate through the pages in the report by either clicking on the pages listed below, or by using the keyword search tool below to find specific information within the annual report.-
 1
1 -
2
-
3
-
4
-
5
-
6
-
7
-
8
-
9
-
10
-
11
-
12
-
13
-
14
-
15
-
16
-
17
-
18
-
19
-
20
-
21
-
22
-
23
-
24
-
25
-
26
-
27
-
28
-
29
-
30
-
31
-
32
-
33
-
34
-
35
-
36
-
37
-
38
-
39
-
40
-
41
-
42
-
43
-
44
-
45
-
46
-
47
-
48
-
49
-
50
-
51
-
52
-
53
-
54
-
55
-
56
-
57
-
58
-
59
-
60
-
61
-
62
-
63
-
64
-
65
-
66
-
67
-
68
-
69
-
70
-
71
-
72
-
73
-
74
-
75
-
76
-
77
-
78
-
79
-
80
-
81
-
82
-
83
-
84
-
85
-
86
-
87
-
88
-
89
-
90
-
91
-
92
-
93
-
94
-
95
-
96
-
97
-
98
-
99
-
100
-
101
-
102
-
103
-
104
-
105
-
106
-
107
-
108
-
109
-
110
-
111
-
112
-
113
-
114
-
115
-
116
-
117
-
118
-
119
-
120
-
121
-
122
-
123
-
124
-
125
-
126
-
127
-
128
-
129
-
130
-
131
-
132
-
133
-
134
-
135
-
136
-
137
-
138
-
139
-
140
-
141
-
142
-
143
-
144
-
145
-
146
-
147
-
148
-
149
-
150
-
151
-
152
-
153
-
154
-
155
-
156
-
157
-
158
-
159
-
160
-
161
-
162
-
163
-
164
-
165
-
166
-
167
-
168
-
169
-
170
-
 171
171 -
 172
172 -
 173
173 -
 174
174 -
 175
175 -
 176
176 -
 177
177 -
 178
178 -
 179
179 -
 180
180 -
 181
181 -
 182
182 -
 183
183 -
 184
184 -
 185
185 -
 186
186 -
 187
187 -
 188
188 -
 189
189 -
 190
190 -
 191
191 -
192
-
193
-
194
-
195
-
196
-
197
-
198
-
199
-
200
-
201
-
202
-
203
-
204
-
205
-
206
-
207
-
208
-
209
-
210
-
211
-
212
 |
 |

1 7 9
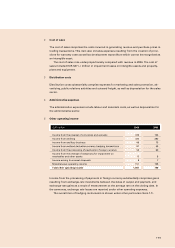
2 Cost of sales
The cost of sales comprises the costs incurred in generating revenue and purchase prices in
trading transactions. This item also includes expenses resulting from the creation of provi-
sions for warranty costs as well as development expenditure which cannot be recognised as
an intangible asset.
The cost of sales rose underproportionally compared with revenue in 2006. The cost of
sales included EUR 547 (–) million in impairment losses on intangible assets and property,
plant and equipment.
3 Distribution costs
Distribution costs substantially comprise expenses for marketing and sales promotion, ad-
vertising, public relations activities and outward freight, as well as depreciation for the sales
sector.
4 Administrative expenses
The administrative expenses include labour and materials costs, as well as depreciation for
the administrative sector.
5 Other operating income
EUR million 2006 2005
Income from the reversal of provisions and accruals 326 153
Income from rebilling 324 282
Income from ancillary business 88 75
Income from realised derivative currency hedging transactions 87 44
Income from the processing of payments in foreign currency 54 66
Income from the reversal of reductions for impairment on
receivables and other assets 13 8
Income arising from asset disposals 8 7
Miscellaneous operating income 151 155
Total other operating income 1,051 790
Income from the processing of payments in foreign currency substantially comprises gains
resulting from exchange-rate movements between the dates of output and payment, and
exchange-rate gains as a result of measurement at the average rate on the closing date. In
the same way, exchange rate losses are reported under other operating expenses.
The overall item of hedging instruments is shown under other particulars (item 1.1).