Audi 2006 Annual Report Download - page 154
Download and view the complete annual report
Please find page 154 of the 2006 Audi annual report below. You can navigate through the pages in the report by either clicking on the pages listed below, or by using the keyword search tool below to find specific information within the annual report.-
 1
1 -
2
-
3
-
4
-
5
-
6
-
7
-
8
-
9
-
10
-
11
-
12
-
13
-
14
-
15
-
16
-
17
-
18
-
19
-
20
-
21
-
22
-
23
-
24
-
25
-
26
-
27
-
28
-
29
-
30
-
31
-
32
-
33
-
34
-
35
-
36
-
37
-
38
-
39
-
40
-
41
-
42
-
43
-
44
-
45
-
46
-
47
-
48
-
49
-
50
-
51
-
52
-
53
-
54
-
55
-
56
-
57
-
58
-
59
-
60
-
61
-
62
-
63
-
64
-
65
-
66
-
67
-
68
-
69
-
70
-
71
-
72
-
73
-
74
-
75
-
76
-
77
-
78
-
79
-
80
-
81
-
82
-
83
-
84
-
85
-
86
-
87
-
88
-
89
-
90
-
91
-
92
-
93
-
94
-
95
-
96
-
97
-
98
-
99
-
100
-
101
-
102
-
103
-
104
-
105
-
106
-
107
-
108
-
109
-
110
-
111
-
112
-
113
-
114
-
115
-
116
-
117
-
118
-
119
-
120
-
121
-
122
-
123
-
124
-
125
-
126
-
127
-
128
-
129
-
130
-
131
-
132
-
133
-
134
-
135
-
136
-
137
-
138
-
139
-
140
-
141
-
142
-
143
-
 144
144 -
 145
145 -
 146
146 -
 147
147 -
 148
148 -
 149
149 -
 150
150 -
 151
151 -
 152
152 -
 153
153 -
 154
154 -
 155
155 -
 156
156 -
 157
157 -
 158
158 -
 159
159 -
 160
160 -
 161
161 -
 162
162 -
 163
163 -
 164
164 -
165
-
166
-
167
-
168
-
169
-
170
-
171
-
172
-
173
-
174
-
175
-
176
-
177
-
178
-
179
-
180
-
181
-
182
-
183
-
184
-
185
-
186
-
187
-
188
-
189
-
190
-
191
-
192
-
193
-
194
-
195
-
196
-
197
-
198
-
199
-
200
-
201
-
202
-
203
-
204
-
205
-
206
-
207
-
208
-
209
-
210
-
211
-
212
 |
 |
1 5 2
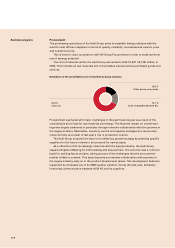
Current liabilities rose to EUR 7,035 (5,806) million. Within this, current provisions
showed an increase on the prior-year level due to the sales volume, and other liabilities rose
following the higher profit transfer to Volkswagen AG.
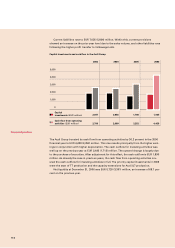
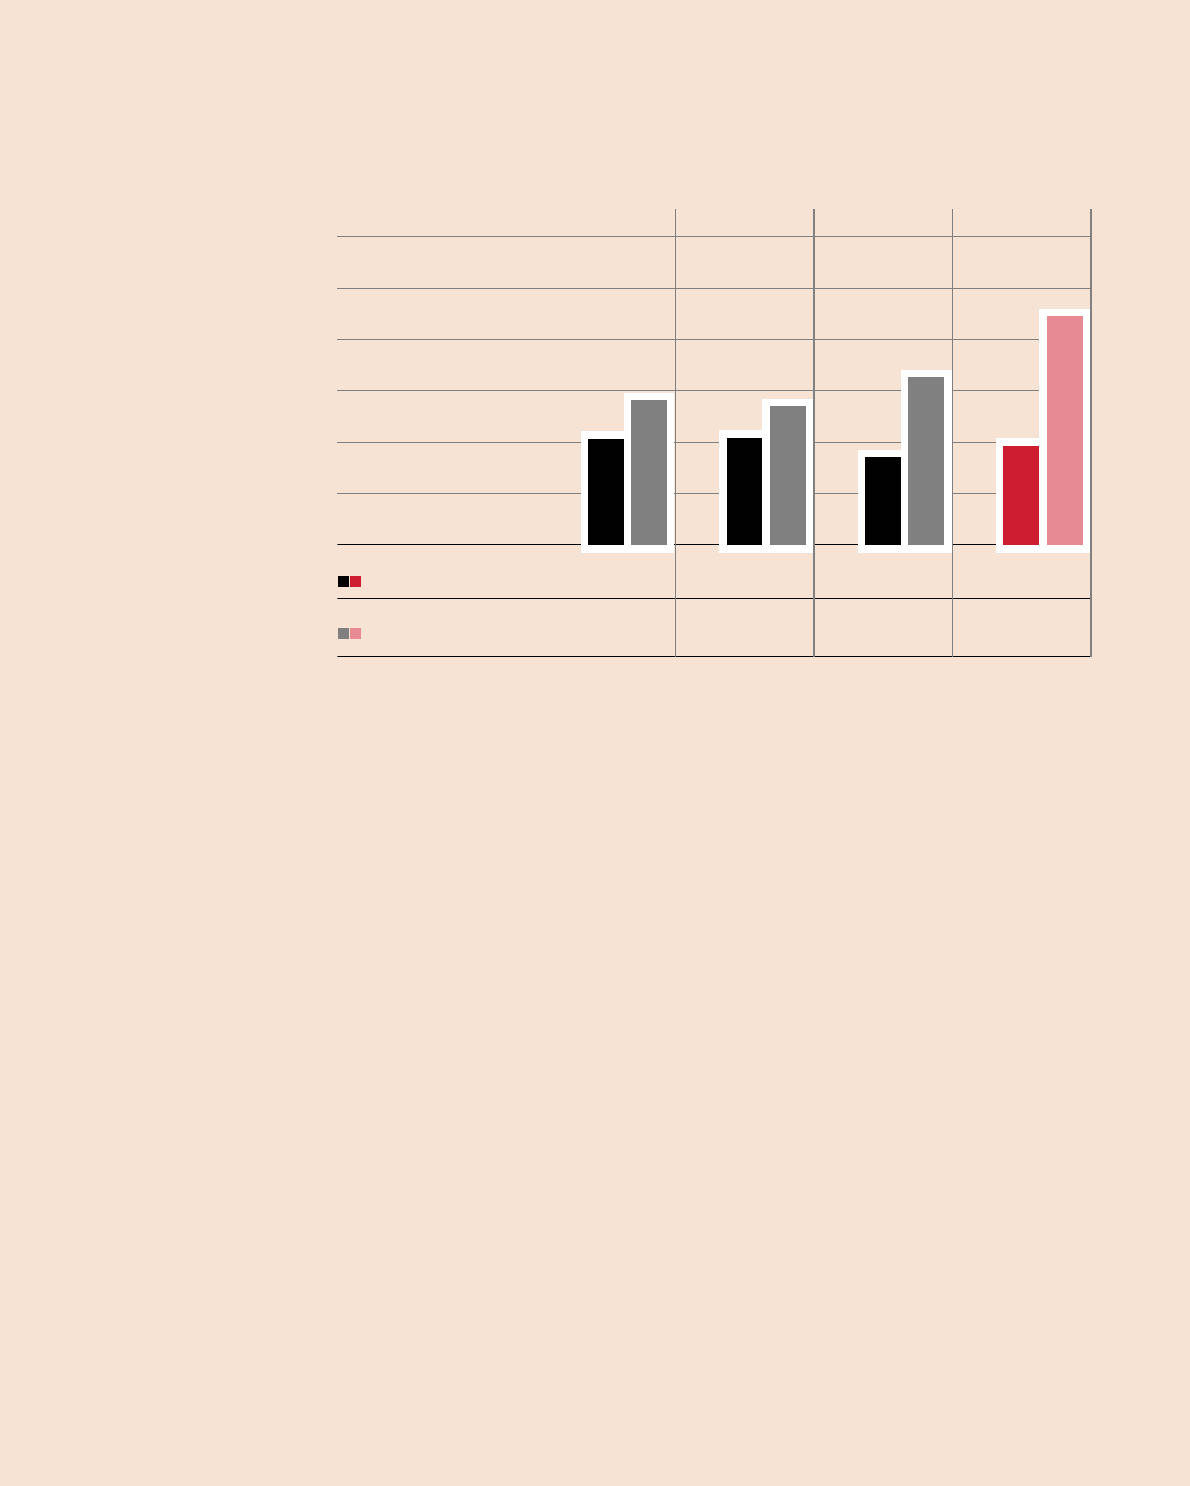
Capital investments and cash flow in the Audi Group
4,000
3,000
2,000
1,000
0
Capital
investments (EUR million)
Cash flow from operating
activities (EUR million)
5,000
1,708
3,252
2005 2006
1,925
4,428
2,047
2,786
2003
2,056
2,690
2004
Financial position
The Audi Group boosted its cash flow from operating activities by 36.2 percent in the 2006
financial year to EUR 4,428 (3,252) million. This rise results principally from the higher earn-
ings in conjunction with higher depreciation. The cash outflow for investing activities was
well up on the previous year at EUR 2,442 (1,712) million. The upward change is largely due
to the purchase of securities. After adjustment for this effect, the cash outflow is EUR 1,890
million. As already the case in previous years, the cash flow from operating activities cov-
ered the cash outflow for investing activities in full. The priority capital investments in 2006
were the start of TT production and the capacity extensions for Audi Q7 production.
Net liquidity at December 31, 2006 was EUR 5,720 (3.391) million, an increase of 68.7 per-
cent on the previous year.