Audi 2006 Annual Report Download - page 195
Download and view the complete annual report
Please find page 195 of the 2006 Audi annual report below. You can navigate through the pages in the report by either clicking on the pages listed below, or by using the keyword search tool below to find specific information within the annual report.-
 1
1 -
2
-
3
-
4
-
5
-
6
-
7
-
8
-
9
-
10
-
11
-
12
-
13
-
14
-
15
-
16
-
17
-
18
-
19
-
20
-
21
-
22
-
23
-
24
-
25
-
26
-
27
-
28
-
29
-
30
-
31
-
32
-
33
-
34
-
35
-
36
-
37
-
38
-
39
-
40
-
41
-
42
-
43
-
44
-
45
-
46
-
47
-
48
-
49
-
50
-
51
-
52
-
53
-
54
-
55
-
56
-
57
-
58
-
59
-
60
-
61
-
62
-
63
-
64
-
65
-
66
-
67
-
68
-
69
-
70
-
71
-
72
-
73
-
74
-
75
-
76
-
77
-
78
-
79
-
80
-
81
-
82
-
83
-
84
-
85
-
86
-
87
-
88
-
89
-
90
-
91
-
92
-
93
-
94
-
95
-
96
-
97
-
98
-
99
-
100
-
101
-
102
-
103
-
104
-
105
-
106
-
107
-
108
-
109
-
110
-
111
-
112
-
113
-
114
-
115
-
116
-
117
-
118
-
119
-
120
-
121
-
122
-
123
-
124
-
125
-
126
-
127
-
128
-
129
-
130
-
131
-
132
-
133
-
134
-
135
-
136
-
137
-
138
-
139
-
140
-
141
-
142
-
143
-
144
-
145
-
146
-
147
-
148
-
149
-
150
-
151
-
152
-
153
-
154
-
155
-
156
-
157
-
158
-
159
-
160
-
161
-
162
-
163
-
164
-
165
-
166
-
167
-
168
-
169
-
170
-
171
-
172
-
173
-
174
-
175
-
176
-
177
-
178
-
179
-
180
-
181
-
182
-
183
-
184
-
 185
185 -
 186
186 -
 187
187 -
 188
188 -
 189
189 -
 190
190 -
 191
191 -
 192
192 -
 193
193 -
 194
194 -
 195
195 -
 196
196 -
 197
197 -
 198
198 -
 199
199 -
 200
200 -
 201
201 -
 202
202 -
 203
203 -
 204
204 -
 205
205 -
206
-
207
-
208
-
209
-
210
-
211
-
212
 |
 |

1 9 3
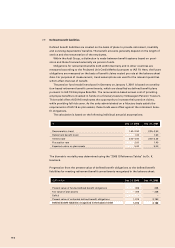
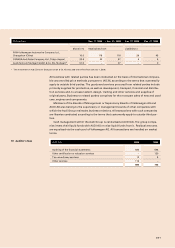
The experience adjustments, in other words the effects of differences between the previous
actuarial assumptions and what has actually occurred, are shown in the following table:
EUR million 2006 2005 2004
Difference between anticipated and
actual performance
as % of the present value of the obligation 0.29 0.15 2.43
as % of the fair value of the plan asset 1.65 4.75 1.05
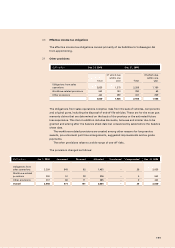
The amounts recognised in the income statement are as follows:
EUR million 2006 2005
Current service cost for services provided by the employees
in the financial year 71 66
Past service cost 28 –
Interest cost 104 100
Expected return on plan assets – 13 – 11
Total of expense and income recognised in the income statement 190 155
The interest element in pension costs is shown as interest cost in the other financial result.
The anticipated return on plan assets is likewise shown in the financial result.
There was an actual gain from plan assets of EUR 18 (22) million in the past financial
year.
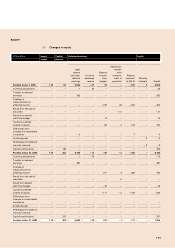
The defined benefit liabilities recognised in the balance sheet are determined by offset-
ting the present value against the fund assets pursuant to IAS 19. The provisions changed
as follows:
EUR million 2006 2005
Defined benefit liabilities at January 1 2,180 1,820
Changes to the group – – 10
Employee benefit expenses 190 155
Actuarial gains / losses – 284 322
Pension payments from company assets – 61 – 57
Contributions paid to funds – 50 – 50
Transfers received from affiliated companies – 1 2
Transfers made to affiliated companies 1 – 2
Currency differences – 1 0
Defined benefit liabilities at December 31 1,974 2,180
of which non-current 1,913 2,121