Audi 2006 Annual Report Download - page 153
Download and view the complete annual report
Please find page 153 of the 2006 Audi annual report below. You can navigate through the pages in the report by either clicking on the pages listed below, or by using the keyword search tool below to find specific information within the annual report.-
 1
1 -
2
-
3
-
4
-
5
-
6
-
7
-
8
-
9
-
10
-
11
-
12
-
13
-
14
-
15
-
16
-
17
-
18
-
19
-
20
-
21
-
22
-
23
-
24
-
25
-
26
-
27
-
28
-
29
-
30
-
31
-
32
-
33
-
34
-
35
-
36
-
37
-
38
-
39
-
40
-
41
-
42
-
43
-
44
-
45
-
46
-
47
-
48
-
49
-
50
-
51
-
52
-
53
-
54
-
55
-
56
-
57
-
58
-
59
-
60
-
61
-
62
-
63
-
64
-
65
-
66
-
67
-
68
-
69
-
70
-
71
-
72
-
73
-
74
-
75
-
76
-
77
-
78
-
79
-
80
-
81
-
82
-
83
-
84
-
85
-
86
-
87
-
88
-
89
-
90
-
91
-
92
-
93
-
94
-
95
-
96
-
97
-
98
-
99
-
100
-
101
-
102
-
103
-
104
-
105
-
106
-
107
-
108
-
109
-
110
-
111
-
112
-
113
-
114
-
115
-
116
-
117
-
118
-
119
-
120
-
121
-
122
-
123
-
124
-
125
-
126
-
127
-
128
-
129
-
130
-
131
-
132
-
133
-
134
-
135
-
136
-
137
-
138
-
139
-
140
-
141
-
142
-
 143
143 -
 144
144 -
 145
145 -
 146
146 -
 147
147 -
 148
148 -
 149
149 -
 150
150 -
 151
151 -
 152
152 -
 153
153 -
 154
154 -
 155
155 -
 156
156 -
 157
157 -
 158
158 -
 159
159 -
 160
160 -
 161
161 -
 162
162 -
 163
163 -
164
-
165
-
166
-
167
-
168
-
169
-
170
-
171
-
172
-
173
-
174
-
175
-
176
-
177
-
178
-
179
-
180
-
181
-
182
-
183
-
184
-
185
-
186
-
187
-
188
-
189
-
190
-
191
-
192
-
193
-
194
-
195
-
196
-
197
-
198
-
199
-
200
-
201
-
202
-
203
-
204
-
205
-
206
-
207
-
208
-
209
-
210
-
211
-
212
 |
 |

1 5 1
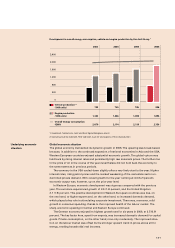
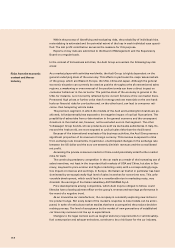
Net worth
Balance sheet structure
InventoriesInventories
Other
current assets
Fixed assets
Other non-
current assets
Equity
Non-current
liabilities
Current
liabilities
2006200520042003 2003200420052006EUR million 2006200520042003 2003200420052006EUR million
18,910 14,904 14,063
5,828
4,291
4,785
5,487
3,701
4,875
14,904
8,430
540
1,832
2,343
1,759
8,263
325
1,814
2,453
1,208
14,063
8,143
454
2,042
2,368
3,105
16.112 18,910 16,112
6,104
4,202
5,806
7,536
749
2,109
3,632
4,884
7,265
4,610
7,035
18,910 14,904 14,063
5,828
4,291
4,785
5,487
3,701
4,875
14,904
8,430
540
1,832
2,343
1,759
8,263
325
1,814
2,453
1,208
14,063
8,143
454
2,042
2,368
3,105
16.112 18,910 16,112
6,104
4,202
5,806
7,536
749
2,109
3,632
4,884
7,265
4,610
7,035
Cash and cash
equivalents
The balance sheet total of the Audi Group at December 31, 2006 was EUR 18,910 (16,112)
million, an increase of 17.4 percent on the prior-year total.
Non-current assets were down 3.6 percent to EUR 8,285 (8,597) million mainly as a result
of higher depreciation and lower development expenditure recognised as an intangible
asset.
Current assets, on the other hand, were up 41.4 percent to EUR 10,625 (7,515) million.
This change is attributable above all to the increase in cash and cash equivalents (plus
EUR 1,779 million), the rise in trade receivables (plus EUR 342 million) and the higher level
of securities held as current assets (plus EUR 555 million).
Capital investments were 12.7 percent up on the previous year at EUR 1,925 (1,708) mil-
lion, mainly due to increased production capacity. EUR 1,256 (1,138) million of this total was
spent on property, plant and equipment, representing a rise of 10.4 percent.
The 19.0 percent rise in equity to EUR 7.265 (6,104) million is primarily due to the capital
injection of EUR 231 million by Volkswagen AG and the allocation to the other retained earn-
ings of the balance of EUR 487 (362) million remaining after the transfer of profit. Actuarial
gains from the remeasurement of defined benefit liabilities moreover affected this figure.
The equity ratio of the Audi Group consequently rose to 38.4 (37.9) percent.
Non-current liabilities were up on the previous year at EUR 4,610 (4,202) million. In par-
ticular, other liabilities and provisions also rose.