Air New Zealand 2016 Annual Report Download - page 8
Download and view the complete annual report
Please find page 8 of the 2016 Air New Zealand annual report below. You can navigate through the pages in the report by either clicking on the pages listed below, or by using the keyword search tool below to find specific information within the annual report.-
 1
1 -
 2
2 -
 3
3 -
 4
4 -
 5
5 -
 6
6 -
 7
7 -
 8
8 -
 9
9 -
 10
10 -
 11
11 -
 12
12 -
 13
13 -
 14
14 -
 15
15 -
 16
16 -
 17
17 -
 18
18 -
 19
19 -
20
-
21
-
22
-
23
-
24
-
25
-
26
-
27
-
28
-
29
-
30
-
31
-
32
-
33
-
34
-
35
-
36
-
37
-
38
-
39
-
40
-
41
-
42
-
43
-
44
-
45
-
46
-
47
-
48
-
49
-
50
-
51
-
52
-
53
-
54
-
55
-
56
-
57
-
58
-
59
-
60
-
61
-
62
-
63
-
64
-
65
-
66
-
67
-
68
-
69
-
70
-
71
-
72
 |
 |

AIR NEW ZEAL AND ANNUAL FINANCIAL RESULTS 2016
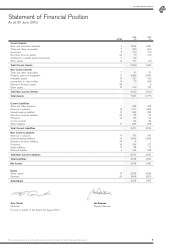
The accompanying accounting policies and notes form part of these financial statements.6
AIR NEW ZEAL AND ANNUAL FINANCIAL RESULTS 2016
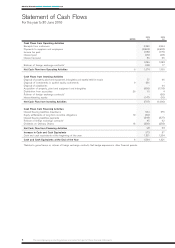
Statement of Cash Flows
For the year to 30 June 2016
NOTES
2016
$M
2015
$M
Cash Flows from Operating Activities
Receipts from customers
Payments to suppliers and employees
Income tax paid
Interest paid
Interest received
5,290
(3,969)
(185)
(96)
56
4,994
(3,698)
(170)
(98)
55
Rollover of foreign exchange contracts*
1,096
(22)
1,083
17
Net Cash Flow from Operating Activities 61,074 1,100
Cash Flows from Investing Activities
Disposal of property, plant and equipment, intangibles and assets held for resale
Disposal of investments in quoted equity instruments
Disposal of subsidiaries
Acquisition of property, plant and equipment and intangibles
Distribution from associates
Rollover of foreign exchange contracts*
Interest-bearing assets
9
26
57
281
-
(998)
10
-
(147)
46
-
44
(1,118)
4
(26)
(16)
Net Cash Flow from Investing Activities (797) (1,066)
Cash Flows from Financing Activities
Interest-bearing liabilities drawdowns
Equity settlements of long-term incentive obligations
Interest-bearing liabilities payments
Rollover of foreign exchange contracts*
Dividends on Ordinary Shares
19
18
564
(39)
(344)
45
(230)
576
-
(327)
62
(258)
Net Cash Flow from Financing Activities (4) 53
Increase in Cash and Cash Equivalents
Cash and cash equivalents at the beginning of the year
273
1,321
87
1,234
Cash and Cash Equivalents at the End of the Year 61,594 1,321
*Relates to gains/losses on rollover of foreign exchange contracts that hedge exposures in other financial periods.