Air New Zealand 2016 Annual Report Download - page 14
Download and view the complete annual report
Please find page 14 of the 2016 Air New Zealand annual report below. You can navigate through the pages in the report by either clicking on the pages listed below, or by using the keyword search tool below to find specific information within the annual report.-
 1
1 -
2
-
3
-
 4
4 -
 5
5 -
 6
6 -
 7
7 -
 8
8 -
 9
9 -
 10
10 -
 11
11 -
 12
12 -
 13
13 -
 14
14 -
 15
15 -
 16
16 -
 17
17 -
 18
18 -
 19
19 -
 20
20 -
 21
21 -
 22
22 -
 23
23 -
 24
24 -
25
-
26
-
27
-
28
-
29
-
30
-
31
-
32
-
33
-
34
-
35
-
36
-
37
-
38
-
39
-
40
-
41
-
42
-
43
-
44
-
45
-
46
-
47
-
48
-
49
-
50
-
51
-
52
-
53
-
54
-
55
-
56
-
57
-
58
-
59
-
60
-
61
-
62
-
63
-
64
-
65
-
66
-
67
-
68
-
69
-
70
-
71
-
72
 |
 |

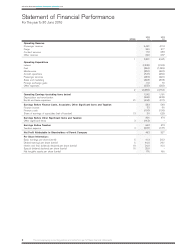
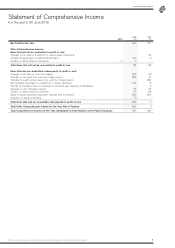
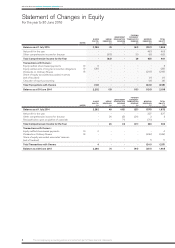
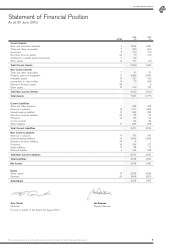
AIR NEW ZEAL AND ANNUAL FINANCIAL RESULTS 2016
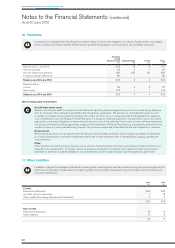
Notes to the Financial Statements (continued)
For the year to and as at 30 June 2016
12
AIR NEW ZEAL AND ANNUAL FINANCIAL RESULTS 2016
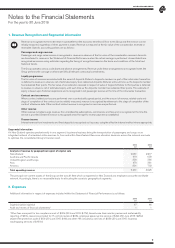
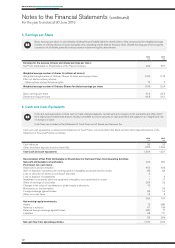
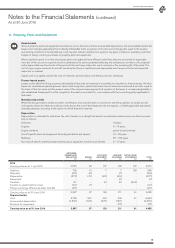
6. Cash and Cash Equivalents
Cash and cash equivalents include cash on hand, demand deposits, current accounts in banks net of overdrafts and other short-
term highly liquid investments that are readily convertible to known amounts of cash and which are subject to an insignificant risk
of changes in value.
Cash flows are included in the Statement of Cash Flows net of Goods and Services Tax.
Cash and cash equivalents, as stated in the Statement of Cash Flows, are reconciled to the Bank and short-term deposits balance in the
Statement of Financial Position as follows:
2016
$M
2015
$M
Cash balances
Other short-term deposits and short-term bills
20
1,574
22
1,299
Total cash and cash equivalents 1,594 1,321
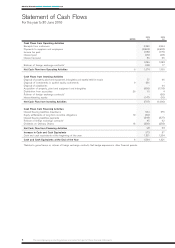
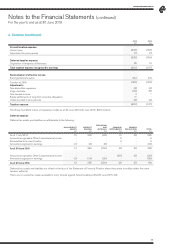
Reconciliation of Net Profit Attributable to Shareholders to Net Cash Flows from Operating Activities:
Net profit attributable to shareholders
Plus/(less) non-cash items:
Depreciation and amortisation
Gain on disposal of property, plant and equipment, intangibles and assets held for resale
Loss on cessation of equity accounting of associate
Loss on disposal of subsidiaries
Impairment on property, plant and equipment, intangibles and assets held for resale
Share of earnings of associates
Changes in fair value of investments in quoted equity instruments
Movements on fuel derivatives
Foreign exchange (gains)/losses
Other non-cash items
463
465
(5)
2
-
1
(20)
79
-
(9)
13
327
402
(2)
-
4
17
22
-
20
16
8
Net working capital movements:
Assets
Revenue in advance
Deferred foreign exchange (gains)/losses
Liabilities
989
12
67
(22)
28
814
(38)
136
17
171
85 286
Net cash flow from operating activities 1,074 1,100
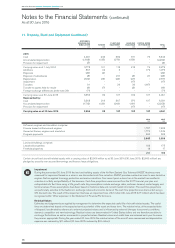
5. Earnings per Share
Basic earnings per share is calculated by dividing the profit attributable to shareholders of the company by the weighted average
number of ordinary shares on issue during the year, excluding shares held as treasury stock. Diluted earnings per share assumes
conversion of all dilutive potential ordinary shares in determining the denominator.
2016
$M
2015
$M
Earnings for the purpose of basic and diluted earnings per share:
Net Profit Attributable to Shareholders of the Parent Company 463 327
Weighted average number of shares (in millions of shares)
Weighted average number of Ordinary Shares for basic earnings per share
Effect of dilutive ordinary shares:
- Share options and performance rights
1,122
14
1,118
6
Weighted average number of Ordinary Shares for diluted earnings per share 1,136 1,124
Basic earnings per share
Diluted earnings per share
41.3
40.8
29.2
29.1