Air New Zealand 2016 Annual Report Download - page 47
Download and view the complete annual report
Please find page 47 of the 2016 Air New Zealand annual report below. You can navigate through the pages in the report by either clicking on the pages listed below, or by using the keyword search tool below to find specific information within the annual report.-
 1
1 -
2
-
3
-
4
-
5
-
6
-
7
-
8
-
9
-
10
-
11
-
12
-
13
-
14
-
15
-
16
-
17
-
18
-
19
-
20
-
21
-
22
-
23
-
24
-
25
-
26
-
27
-
28
-
29
-
30
-
31
-
32
-
33
-
34
-
35
-
36
-
 37
37 -
 38
38 -
 39
39 -
 40
40 -
 41
41 -
 42
42 -
 43
43 -
 44
44 -
 45
45 -
 46
46 -
 47
47 -
 48
48 -
 49
49 -
 50
50 -
 51
51 -
 52
52 -
 53
53 -
 54
54 -
 55
55 -
 56
56 -
 57
57 -
58
-
59
-
60
-
61
-
62
-
63
-
64
-
65
-
66
-
67
-
68
-
69
-
70
-
71
-
72
 |
 |

45
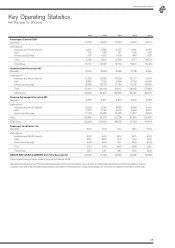
AIR NEW ZEALAND GROUP
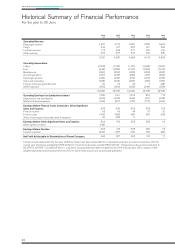
Historical Summary of Financial Position
As at 30 June
2016
$M
2015
$M
2014
$M
2013
$M
2012
$M
Current Assets
Bank and short-term deposits
Other current assets
1,594
745
1,321
661
1,234
593
1,150
693
1,029
658
Total Current Assets 2,339 1,982 1,827 1,843 1,687
Non-Current Assets
Property, plant and equipment
Other non-current assets
4,485
427
4,061
732
3,279
744
2,933
820
3,090
668
Total Non-Current Assets 4,912 4,793 4,023 3,753 3,758
Total Assets 7,251 6,775 5,850 5,596 5,445
Current Liabilities
Debt1
Other current liabilities
464
2,007
253
1,875
190
1,682
159
1,555
157
1,544
Total Current Liabilities 2,471 2,128 1,872 1,714 1,701
Non-Current liabilities
Debt1
Other non-current liabilities
2,103
569
2,069
613
1,543
563
1,470
611
1,537
544
Total Non-Current Liabilities 2,672 2,682 2,106 2,081 2,081
Total Liabilities 5,143 4,810 3,978 3,795 3,782
Net Assets 2,108 1,965 1,872 1,801 1,663
Total Equity 2,108 1,965 1,872 1,801 1,663
1. Debt is comprised of bank overdraft, secured borrowings, bonds and finance lease liabilities.
Certain comparatives within the five year statistical review have been reclassified for comparative purposes, to ensure consistency with the
current year. The Group adopted NZ IFRS 9 (2010) - Financial Instruments and NZ IFRS 9 (2013) - Hedge Accounting and amendments to
NZ IFRS 9, NZ IFRS 7 and NZ IAS 39 on 1 July 2014. Comparatives have been restated for the 2014 financial year only in respect of the
adopted standards and the amounts for the 2012 to 2013 financial years are as previously published.
Historical Summary of Cash Flows
For the year to 30 June
2016
$M
2015
$M
2014
$M
2013
$M
2012
$M
Cash flow from operating activities
Cash flow from investing activities
Cash flow from financing activities
1,074
(797)
(4)
1,100
(1,066)
53
730
(727)
81
750
(480)
(147)
472
(654)
349
Increase in cash holding 273 87 84 123 167
Total cash and cash equivalents 1,594 1,321 1,234 1,150 1,027