Air New Zealand 2016 Annual Report Download - page 21
Download and view the complete annual report
Please find page 21 of the 2016 Air New Zealand annual report below. You can navigate through the pages in the report by either clicking on the pages listed below, or by using the keyword search tool below to find specific information within the annual report.-
 1
1 -
2
-
3
-
4
-
5
-
6
-
7
-
8
-
9
-
10
-
 11
11 -
 12
12 -
 13
13 -
 14
14 -
 15
15 -
 16
16 -
 17
17 -
 18
18 -
 19
19 -
 20
20 -
 21
21 -
 22
22 -
 23
23 -
 24
24 -
 25
25 -
 26
26 -
 27
27 -
 28
28 -
 29
29 -
 30
30 -
 31
31 -
32
-
33
-
34
-
35
-
36
-
37
-
38
-
39
-
40
-
41
-
42
-
43
-
44
-
45
-
46
-
47
-
48
-
49
-
50
-
51
-
52
-
53
-
54
-
55
-
56
-
57
-
58
-
59
-
60
-
61
-
62
-
63
-
64
-
65
-
66
-
67
-
68
-
69
-
70
-
71
-
72
 |
 |

Notes to the Financial Statements (continued)
As at 30 June 2016
19
AIR NEW ZEALAND GROUP
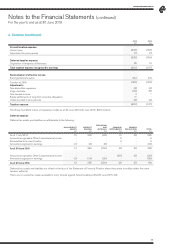
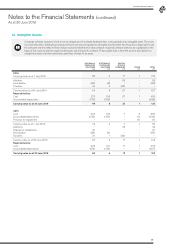
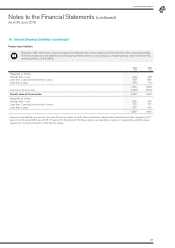
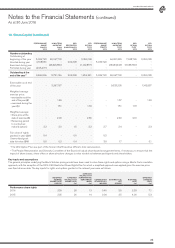
13. Investment in Other Entities (continued)
Summary financial information of associates
CEC
2016
$M
TOTAL
2016
$M
VIRGIN
AUSTRALIA
2015
$M
CEC
2015
$M
TOTAL
2015
$M
Assets and liabilities of associates* are as follows:
Current assets
Non-current assets
Current liabilities
Non-current liabilities
181
43
(44)
(24)
181
43
(44)
(24)
1,778
4,720
(2,598)
(2,880)
156
47
(51)
(25)
1,934
4,767
(2,649)
(2,905)
Net assets
Less non-controlling interest
156
-
156
-
1,020
63
127
-
1,147
63
Net identifiable assets 156 156 1,083 127 1,210
Group share of net identifiable assets
Goodwill
76
-
76
-
281
79
62
-
343
79
Carrying value of investment in associates 76 76 360 62 422
Investments at quoted market price N/A N/A 440 N/A N/A
VIRGIN
AUSTRALIA
9 MONTHS TO
MARCH 2016
$M
CEC
2016
$M
TOTAL
2016
$M
VIRGIN
AUSTRALIA
2015
$M
CEC
2015
$M
TOTAL
2015
$M
Results of associates*
Revenue
Earnings after taxation
Other comprehensive losses (net of taxation)
4,191
15
(104)
496
46
-
4,687
61
(104)
5,098
(93)
(199)
387
15
-
5,485
(78)
(199)
Total comprehensive income (89) 46 (43) (292) 15 (277)
Non-controlling interest 25 -25 18 -18
Group share of net earnings after taxation (3) 23 20 (29) 7 (22)
Group share of total comprehensive income (29) 23 (6) (79) 7(72)
*Inclusive of fair value adjustments identified at the date of obtaining significant influence, less amortisation.