Air New Zealand 2016 Annual Report Download - page 27
Download and view the complete annual report
Please find page 27 of the 2016 Air New Zealand annual report below. You can navigate through the pages in the report by either clicking on the pages listed below, or by using the keyword search tool below to find specific information within the annual report.-
 1
1 -
2
-
3
-
4
-
5
-
6
-
7
-
8
-
9
-
10
-
11
-
12
-
13
-
14
-
15
-
16
-
 17
17 -
 18
18 -
 19
19 -
 20
20 -
 21
21 -
 22
22 -
 23
23 -
 24
24 -
 25
25 -
 26
26 -
 27
27 -
 28
28 -
 29
29 -
 30
30 -
 31
31 -
 32
32 -
 33
33 -
 34
34 -
 35
35 -
 36
36 -
 37
37 -
38
-
39
-
40
-
41
-
42
-
43
-
44
-
45
-
46
-
47
-
48
-
49
-
50
-
51
-
52
-
53
-
54
-
55
-
56
-
57
-
58
-
59
-
60
-
61
-
62
-
63
-
64
-
65
-
66
-
67
-
68
-
69
-
70
-
71
-
72
 |
 |

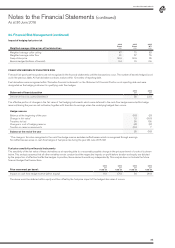
Notes to the Financial Statements (continued)
As at 30 June 2016
25
AIR NEW ZEALAND GROUP
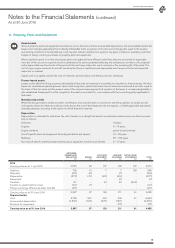
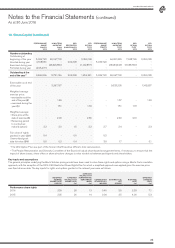
19. Share Capital (continued)
PERFORMANCE
SHARE
RIGHTS
2016
LONG-TERM
INCENTIVE
PLAN
2016
CEO
RESTRICTED
SHARE RIGHTS
2016
CFO
OPTION
PLAN
2016
PERFORMANCE
SHARE
RIGHTS
2015
LONG-TERM
INCENTIVE
PLAN
2015
CEO
OPTION
PLAN*
2015
CFO
OPTION
PLAN
2015
Number outstanding
Outstanding at
beginning of the year
Granted during year
Exercised during year
Forfeited during year
5,036,722
4,728,581
-
(495,407)
48,067,702
-
(28,326,556)
-
-
292,398
-
-
2,399,138
-
(1,142,857)
-
-
5,036,722
-
-
64,051,345
-
(15,983,643)
-
7,938,765
-
(7,938,765)
-
2,399,138
-
-
-
Outstanding at the
end of the year**
9,269,896
19,741,146
292,398
1,256,281
5,036,722
48,067,702
- 2,399,138
Exercisable as at end
of the year
Weighted average
exercise price:
- exercisable as at the
end of the year ($)
- exercised during the
year ($)
Weighted average:
- Share price at the
date of exercise ($)
- Remaining period
to contractual
maturity (years)
Fair value of rights
granted in year ($M)
Unamortised grant
date fair value ($M)
-
-
-
-
2.2
5.4
5.8
3,267,187
1.49
1.51
2.90
2.0
-
0.2
-
-
-
-
1.5
0.6
0.4
-
-
1.34
2.86
2.2
-
-
-
-
-
-
2.7
5.2
3.8
9,033,205
1.57
1.51
2.49
2.4
-
1.7
-
-
1.18
2.19
-
-
-
1,142,857
1.34
-
-
2.3
-
0.1
* The CEO Option Plan was part of the former Chief Executive Officer’s total remuneration.
** The People Remuneration and Diversity Committee of the Board will adjust share-based arrangement terms, if necessary, to ensure that the
impact of share issues, share offers or share structure changes is value neutral as between participants and shareholders.
Key inputs and assumptions
The general principles underlying the Black Scholes pricing model have been used to value these rights and options using a Monte Carlo simulation
approach, with the exception of the 2016 CEO Restricted Share Rights Plan for which a simplified approach was applied given the exercise price
was fixed at issue date. The key inputs for rights and options granted in the relevant year were as follows:
WEIGHTED
AVERAGE
SHARE PRICE
(CENTS)
EXPECTED
VOLATILITY OF
SHARE PRICE
(%)
EXPECTED
VOLATILITY OF
PERFORMANCE
BENCHMARK
INDEX
(%)
CORRELATION
OF VOLATILITY
INDICES
CONTRACTUAL
LIFE
(YEARS)
RISK FREE
RATE
(%)
EXPECTED
DIVIDEND
YIELD
(%)
Performance share rights
2016 239 28 13 0.40 3.5 2.53 7.1
2015 205 26 14 0.34 3.5 4.00 5.3