Air New Zealand 2016 Annual Report Download - page 4
Download and view the complete annual report
Please find page 4 of the 2016 Air New Zealand annual report below. You can navigate through the pages in the report by either clicking on the pages listed below, or by using the keyword search tool below to find specific information within the annual report.-
 1
1 -
 2
2 -
 3
3 -
 4
4 -
 5
5 -
 6
6 -
 7
7 -
 8
8 -
 9
9 -
 10
10 -
 11
11 -
 12
12 -
 13
13 -
 14
14 -
 15
15 -
16
-
17
-
18
-
19
-
20
-
21
-
22
-
23
-
24
-
25
-
26
-
27
-
28
-
29
-
30
-
31
-
32
-
33
-
34
-
35
-
36
-
37
-
38
-
39
-
40
-
41
-
42
-
43
-
44
-
45
-
46
-
47
-
48
-
49
-
50
-
51
-
52
-
53
-
54
-
55
-
56
-
57
-
58
-
59
-
60
-
61
-
62
-
63
-
64
-
65
-
66
-
67
-
68
-
69
-
70
-
71
-
72
 |
 |

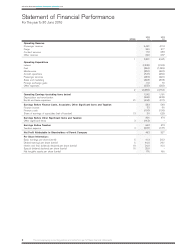
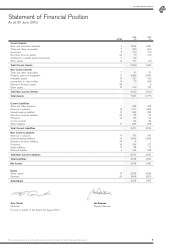
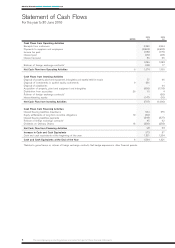
The accompanying accounting policies and notes form part of these financial statements.2
AIR NEW ZEAL AND ANNUAL FINANCIAL RESULTS 2016
NOTES
2016
$M
2015
$M
Operating Revenue
Passenger revenue
Cargo
Contract services
Other revenue
4,481
349
172
229
4 ,113
317
258
237
Operating Expenditure
Labour
Fuel
Maintenance
Aircraft operations
Passenger services
Sales and marketing
Foreign exchange gains
Other expenses
1 5,231
(1,225)
(846)
(350)
(531)
(246)
(348)
112
(255)
4,925
(1,193)
(1,089)
(320)
(466)
(220)
(303)
79
(252)
2 (3,689) (3,764)
Operating Earnings (excluding items below)
Depreciation and amortisation
Rental and lease expenses 21
1,542
(465)
(244)
1,161
(402)
( 211)
Earnings Before Finance Costs, Associates, Other Significant Items and Taxation
Finance income
Finance costs
Share of earnings of associates (net of taxation) 13
833
53
(100)
20
548
56
(108)
(22)
Earnings Before Other Significant Items and Taxation
Other significant items 3
806
(143)
474
-
Earnings Before Taxation
Taxation expense 4
663
(200)
474
(147)
Net Profit Attributable to Shareholders of Parent Company 463 327
Per Share Information:
Basic earnings per share (cents)
Diluted earnings per share (cents)
Interim and final dividends declared per share (cents)
Special dividend declared per share (cents)
Net tangible assets per share (cents)
5
5
18
18
41.3
40.8
20.0
25.0
176
29.2
29.1
16.0
-
166
Statement of Financial Performance
For the year to 30 June 2016