Air New Zealand 2016 Annual Report Download - page 49
Download and view the complete annual report
Please find page 49 of the 2016 Air New Zealand annual report below. You can navigate through the pages in the report by either clicking on the pages listed below, or by using the keyword search tool below to find specific information within the annual report.-
 1
1 -
2
-
3
-
4
-
5
-
6
-
7
-
8
-
9
-
10
-
11
-
12
-
13
-
14
-
15
-
16
-
17
-
18
-
19
-
20
-
21
-
22
-
23
-
24
-
25
-
26
-
27
-
28
-
29
-
30
-
31
-
32
-
33
-
34
-
35
-
36
-
37
-
38
-
 39
39 -
 40
40 -
 41
41 -
 42
42 -
 43
43 -
 44
44 -
 45
45 -
 46
46 -
 47
47 -
 48
48 -
 49
49 -
 50
50 -
 51
51 -
 52
52 -
 53
53 -
 54
54 -
 55
55 -
 56
56 -
 57
57 -
 58
58 -
 59
59 -
60
-
61
-
62
-
63
-
64
-
65
-
66
-
67
-
68
-
69
-
70
-
71
-
72
 |
 |

47
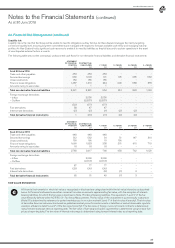
AIR NEW ZEALAND GROUP
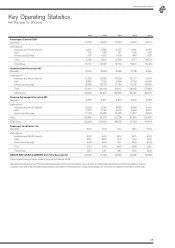
Key Operating Statistics
For the year to 30 June
2016 2015 2014 2013 2012
Passengers Carried (000)
Domestic 9,725 9,246 8,920 8,694 8,500
International
Australia and Pacific Islands
Asia*
America and Europe
3,507
791
1,138
3,388
642
1,021
3,277
517
1,005
3,181
596
940
3,073
652
897
Total 5,436 5,051 4,799 4,717 4,622
Total Group 15,161 14,297 13,719 13 ,411 13,122
Available Seat Kilometres (M)
Domestic 6,065 5,592 5,385 5,108 4,969
International
Australia and Pacific Islands
Asia*
America and Europe
11, 4 3 8
8,349
13,832
10,888
7,022
12,099
10,622
5,656
11,7 3 3
10,277
6,780
11, 0 0 2
9,694
7,495
10,460
Total 33,619 30,009 28 ,011 28,059 27,649
Total Group 39,684 35,601 33,396 33,167 32,618
Revenue Passenger Kilometres (M)
Domestic 4,887 4,561 4,370 4,218 4,050
International
Australia and Pacific Islands
Asia*
America and Europe
9,532
7,070
11,734
9,184
5,784
10,405
8,858
4,630
10,220
8,580
5,418
9,517
8,164
5,979
8,820
Total 28,336 25,373 23,708 23,515 22,963
Total Group 33,223 29,934 28,078 27,733 27,013
Passenger Load Factor (%)
Domestic 80.6 81.6 81.1 82.6 81.5
International
Australia and Pacific Islands
Asia*
America and Europe
83.3
84.7
84.8
84.4
82.4
86.0
83.4
81.9
87.1
83.5
79.9
86.5
84.2
79.8
84.3
Total 84.3 84.6 84.7 83.8 83.1
Total Group 83.7 84.1 84.1 83.6 82.8
GROUP EMPLOYEE NUMBERS (Full Time Equivalents) 10,527 10,196 10,546 10,336 10,453
*Asia included Hong Kong-London flying up until March 2013.
New Zealand, Australia and Pacific Islands represent short haul operations. Asia, America and Europe represent long haul operations. Certain
comparatives within the key operating statistics have been reclassified for comparative purposes, to ensure consistency with the current year.