Air New Zealand 2016 Annual Report Download - page 37
Download and view the complete annual report
Please find page 37 of the 2016 Air New Zealand annual report below. You can navigate through the pages in the report by either clicking on the pages listed below, or by using the keyword search tool below to find specific information within the annual report.-
 1
1 -
2
-
3
-
4
-
5
-
6
-
7
-
8
-
9
-
10
-
11
-
12
-
13
-
14
-
15
-
16
-
17
-
18
-
19
-
20
-
21
-
22
-
23
-
24
-
25
-
26
-
 27
27 -
 28
28 -
 29
29 -
 30
30 -
 31
31 -
 32
32 -
 33
33 -
 34
34 -
 35
35 -
 36
36 -
 37
37 -
 38
38 -
 39
39 -
 40
40 -
 41
41 -
 42
42 -
 43
43 -
 44
44 -
 45
45 -
 46
46 -
 47
47 -
48
-
49
-
50
-
51
-
52
-
53
-
54
-
55
-
56
-
57
-
58
-
59
-
60
-
61
-
62
-
63
-
64
-
65
-
66
-
67
-
68
-
69
-
70
-
71
-
72
 |
 |

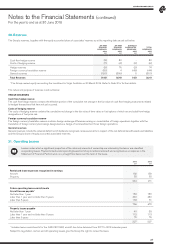
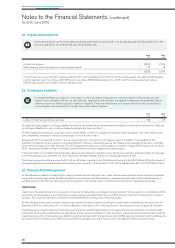
Notes to the Financial Statements (continued)
As at 30 June 2016
35
AIR NEW ZEALAND GROUP
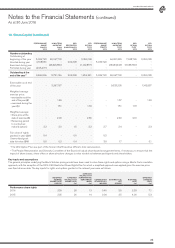
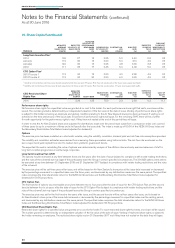
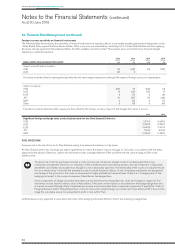
24. Financial Risk Management (continued)
Impact of hedging fuel price risk
Weighted average strike prices of fuel derivatives
2016
Brent
USD
2015
Brent
USD
2015
WTI
USD
Weighted average collar ceiling
Weighted average collar floor
Swap strike price
Barrels hedged (millions of barrels)
47
31
N/A
5.4
70
57
N/A
1.9
83
76
95
0.6
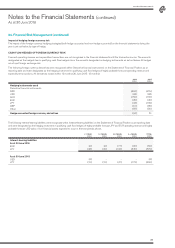
CASH FLOW HEDGES OF FUEL PRICE RISK
Forecast fuel purchase transactions are not recognised in the financial statements until the transactions occur. The number of barrels hedged is set
out in the previous table. All fuel derivative contracts mature within 12 months of reporting date.
Fuel derivatives were recognised within ‘Derivative financial instruments’ on the Statement of Financial Position as at reporting date and were
designated as the hedging instrument in qualifying cash flow hedges.
Statement of financial position 2016
$M
2015
$M
Derivative financial assets/(liabilities) 58 (22)
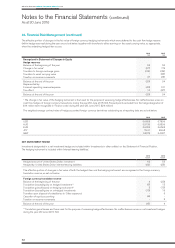
The effective portion of changes in the fair value of fuel hedging instruments which were deferred to the cash flow hedge reserve (within hedge
reserves) during the year are set out below, together with transfers to earnings, when the underlying hedged item occurs.
Hedge reserves
Balance at the beginning of the year
Change in fair value*
Transfers to fuel
Changes in cost of hedging reserve
Taxation on reserve movements
(18)
12
50
(4)
(15)
(2)
(151)
130
(2)
7
Balance at the end of the year 25 (18)
* The change in fair value recognised in the cash flow hedge reserve excludes ineffectiveness which is recognised through earnings.
No ineffectiveness arose on cash flow hedges of fuel price risk during the year (30 June 2015: Nil)
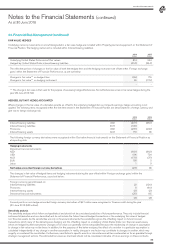
Fuel price sensitivity on financial instruments
The sensitivity of the fair value of these derivatives as at reporting date to a reasonably possible change in the price per barrel of crude oil is shown
below. This analysis assumes that all other variables remain constant and the respective impacts on profit before taxation and equity are dictated
by the proportion of effective/ineffective hedges. In practice, these elements would vary independently. This analysis does not include the future
forecast hedged fuel transactions.
Price movement per barrel:
2016
$M
+USD 20
2016
$M
-USD 20
2015
$M
+USD 20
2015
$M
-USD 20
Impact on cash flow hedge reserve (within equity) 119 (70) 54 (40)
The above would be deferred within equity and then offset by the fuel price impact of the hedged item when it occurs.