Air New Zealand 2016 Annual Report Download - page 48
Download and view the complete annual report
Please find page 48 of the 2016 Air New Zealand annual report below. You can navigate through the pages in the report by either clicking on the pages listed below, or by using the keyword search tool below to find specific information within the annual report.-
 1
1 -
2
-
3
-
4
-
5
-
6
-
7
-
8
-
9
-
10
-
11
-
12
-
13
-
14
-
15
-
16
-
17
-
18
-
19
-
20
-
21
-
22
-
23
-
24
-
25
-
26
-
27
-
28
-
29
-
30
-
31
-
32
-
33
-
34
-
35
-
36
-
37
-
 38
38 -
 39
39 -
 40
40 -
 41
41 -
 42
42 -
 43
43 -
 44
44 -
 45
45 -
 46
46 -
 47
47 -
 48
48 -
 49
49 -
 50
50 -
 51
51 -
 52
52 -
 53
53 -
 54
54 -
 55
55 -
 56
56 -
 57
57 -
 58
58 -
59
-
60
-
61
-
62
-
63
-
64
-
65
-
66
-
67
-
68
-
69
-
70
-
71
-
72
 |
 |

46
AIR NEW ZEAL AND ANNUAL FINANCIAL RESULTS 2016
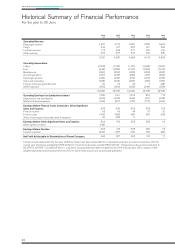
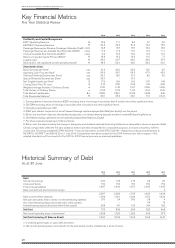
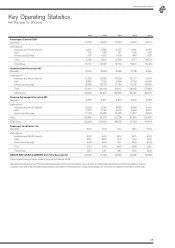
Key Financial Metrics
Five Year Statistical Review
2016 2015 2014 2013 2012
Profitability and Capital Management
EBIT1/Operating Revenue
EBITDRA2/Operating Revenue
Passenger Revenue per Revenue Passenger Kilometre (Yield)
Passenger Revenue per Available Seat Kilometre (RASK)
Cost per Available Seat Kilometre (CASK)3
Return on Invested Capital Pre-tax (ROIC)4
Liquidity ratio5
Gearing (incl. net capitalised aircraft operating leases)6
%
%
cents
cents
cents
%
%
%
15.9
29.5
13.5
11. 3
9.3
18.8
36.0
48.6
11.1
23.6
13.7
11. 6
10.6
16.2
29.7
52.4
8.4
21.6
13.7
11. 5
10.9
14.3
29.2
42.9
6.7
19.4
13.6
11. 4
11. 2
11. 6
29.9
39.3
3.5
15.9
13.5
11.1
11. 6
7.1
27.2
46.1
Shareholder Value
Basic Earnings per Share7
Operating Cash Flow per Share7
Ordinary Dividends Declared per Share7
Special Dividends Declared per Share7
Net Tangible Assets per Share7
Closing Share Price 30 June
Weighted Average Number of Ordinary Shares
Total Number of Ordinary Shares
Total Market Capitalisation
Total Shareholder Returns8
cps
cps
cps
cps
$
$
m
m
$m
%
41.3
95.6
20.0
25.0
1.76
2.10
1,122
1,123
2,352
20.0
29.2
98.1
16.0
-
1.66
2.55
1,118
1,122
2,861
25.6
23.9
65.5
10.0
10.0
1.60
2.08
1,101
1,114
2,318
24.0
16.5
67.9
8.0
-
1.57
1.49
1,096
1,104
1,639
11. 6
6.5
42.9
5.5
-
1.48
0.86
1,096
1,100
946
(16.1)
1. Earnings before interest and taxation (EBIT) excluding share of earnings of associates (net of taxation) and other significant items
2. EBITDRA excluding share of earnings of associates (net of taxation) and other significant items
3. Operating expenditure per ASK
4. (EBIT plus interest component of aircraft leases)/average capital employed (Net Debt plus Equity) over the period
5. (Bank and short-term deposits, interest-bearing deposits, non interest-bearing deposits and bank overdraft)/Operating Revenue
6. Net Debt (including capitalised aircraft operating leases)/(Net Debt plus Equity)
7. Per-share measures based upon Ordinary Shares
8. Return over five years including the change in share price and dividends received (assuming dividends are reinvested in shares on payment date)
Certain comparatives within the five year statistical review have been reclassified for comparative purposes, to ensure consistency with the
current year. The Group adopted NZ IFRS 9 (2010) - Financial Instruments and NZ IFRS 9 (2013) - Hedge Accounting and amendments to
NZ IFRS 9, NZ IFRS 7 and NZ IAS 39 on 1 July 2014. Comparatives have been restated for the 2014 financial year only in respect of the
adopted standards and the amounts for the 2012 to 2013 financial years are as previously published.
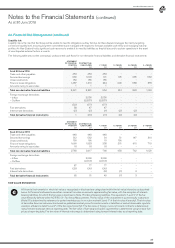
Historical Summary of Debt
As at 30 June
2016
$M
2015
$M
2014
$M
2013
$M
2012
$M
Debt
Secured borrowings
Unsecured bonds
Finance lease liabilities
Bank overdraft and short-term borrowings
930
150
1,487
-
512
150
1,660
-
213
150
1,370
-
84
150
1,395
-
97
150
1,445
2
Bank and short-term deposits
Net open derivatives held in relation to interest-bearing liabilities1
Non interest-bearing deposit (included within Other assets)
Interest-bearing deposits (included within Other assets)
2,567
1,594
(17)
-
288
2,322
1,321
24
-
141
1,733
1,234
(10)
-
125
1,629
1,150
28
44
184
1,694
1,029
4
13
180
Net Debt 702 836 384 223 468
Net aircraft operating lease commitments2 1,288 1,323 1,022 945 973
Net Debt (including off Balance Sheet) 1,990 2,159 1,406 1,168 1,441
1. Unrealised gains/losses on open debt derivatives
2. Net aircraft operating lease commitments for the next twelve months, multiplied by a factor of seven