XM Radio 2001 Annual Report Download - page 33
Download and view the complete annual report
Please find page 33 of the 2001 XM Radio annual report below. You can navigate through the pages in the report by either clicking on the pages listed below, or by using the keyword search tool below to find specific information within the annual report.-
 1
1 -
2
-
3
-
4
-
5
-
6
-
7
-
8
-
9
-
10
-
11
-
12
-
13
-
14
-
15
-
16
-
17
-
18
-
19
-
20
-
21
-
22
-
 23
23 -
 24
24 -
 25
25 -
 26
26 -
 27
27 -
 28
28 -
 29
29 -
 30
30 -
 31
31 -
 32
32 -
 33
33 -
 34
34 -
 35
35 -
 36
36 -
 37
37 -
 38
38 -
 39
39 -
 40
40 -
 41
41 -
 42
42 -
 43
43 -
44
-
45
-
46
-
47
-
48
-
49
-
50
-
51
-
52
-
53
-
54
-
55
-
56
-
57
-
58
-
59
-
60
-
61
-
62
-
63
-
64
 |
 |

FiNANCiALS 2001
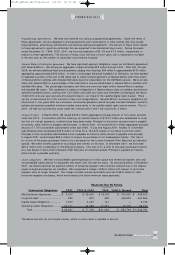
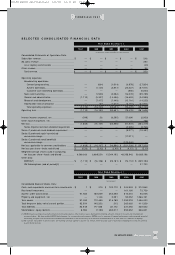
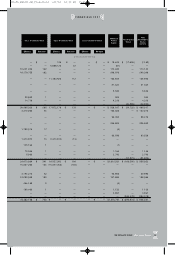
SELECTED CONSOLiDATED FiNANCiAL DATA
(In thousands, except subscriber and share amounts)
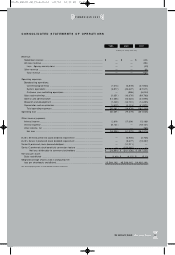
Consolidated Statements of Operations Data:
Subscriber revenue ................................................ $ —$—$—$—$ 246
Ad sales revenue .................................................... — — ——294
Less: Agency commissions ................................ — — ——(43)
Other revenue ........................................................ — — ——36
Total revenue. ....................................................$ —$—$—$—$ 533
Operating expenses:
Broadcasting operations:
Content/ programming .................................... —(664 ) (1,01 4) (6,878 ) (27,9 24)
System operations.......................................... —(1,145 ) (2,87 7) (23,2 27 ) (67,571 )
Customer care and billing operations .............. — — —(856 ) (6,034 )
Sales and marketing .......................................... —(1,523) (3,35 2) (16,0 78 ) (99,789)
General and administrative .................................. (1,11 0) (5,327) (14,496 ) (16,6 24 ) (24 ,5 95 )
Research and development. ................................ —(7 ,4 77 ) (7,44 0) (12,7 01 ) (14,255 )
Depreciation and amortization ............................ —(57) (1,51 2) (3,115 ) (41,971)
Total operating expenses ................................ (1,110) (16,1 93) (30,69 1) (79,479 ) (282 ,1 39 )
Operating loss........................................................ (1,110 ) (16,1 93) (30,69 1) (79,4 79 ) (281 ,6 06 )
Interest income (expense), net ................................ (549 ) 26 (6,205) 27,60 6 (2,93 3)
Other income (expense), net.................................... — — ——160
Net loss ................................................................ (1,65 9) (16,167) (36,896) (51,8 73 ) (284 ,3 79)
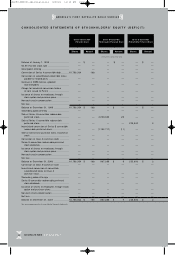
Series B preferred stock dividend requirement .... — — —(5,93 5) (3,766)
Series C preferred stock dividend requirement ........ — — —(9,27 7) (19,3 87)
Series B preferred stock incentivized
conversion charge .............................................. — — —(11,2 11 ) —
Series C preferred stock beneficial
conversion charge .............................................. — — —(123 ,0 42 ) —
Net loss applicable to common stockholders .......... $ (1,65 9) $ (16,167) $ (36,89 6) $ (201 ,3 38 ) $ (307,53 2)
Net loss per share—basic and diluted .................... $ (0.26) $ (2.42 ) $ (2.40) $ (4.15 ) $ (5 .1 3)
Weighted average shares used in computing
net loss per share—basic and diluted .................. 6,368,166 6,689,250 15,344,102 48,508,042 59,920,196
Other Data:
EBITDA(1 ) .......................................................... $ (1,1 10) $ (16,1 36) $ (29,181) $ (76,1 10 ) $ (239 ,1 84 )
XM Subscriptions (end of period)(2 ) .................... — — ——27,733
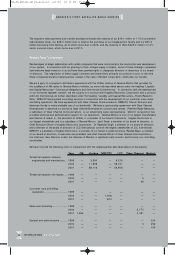
(In thousands)
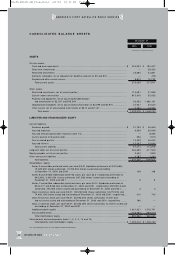
Consolidated Balance Sheets Data:
Cash, cash equivalents and short-term investments .. $ 1 $ 310 $ 120,17 0 $ 224,9 03 $ 210 ,8 52
Restricted investments............................................ — — —161,16 6 72,759
System under construction. .................................... 91,93 2 1 69 ,0 29 362,35 8 81 5,016 55,056
Property and equipment, net .................................. —1,146 2,551 50,05 2 1,0 66,19 1
Total assets .......................................................... 91 ,9 33 170,48 5 515 ,1 89 1,293 ,218 1,456,203
Total long-term debt, net of current portion .............. 82,504 14 0,3 32 212 262,66 5 4 11,520
Total liabilities......................................................... 8 2,949 177,66 8 30 ,1 72 3 37 ,2 66 529,55 2
Stockholders’ equity (deficit).................................... 8,984 (7,18 3) 485,01 7 95 5,9 52 926,65 1
(1) EBITDA means earnings (loss) before interest income and expense, other income, taxes, depreciation (including amounts related to research and development)
and amortization. We have included EBITDA data because it is a commonly used measure. EBITDA is not a measure of financial performance under generally accepted
accounting principles and should not be considered an alternative to net income (loss) as a measure of performance or to cash flows as a measure of liquidity.
(2) We consider subscribers to be those who are receiving and have agreed to pay for our service, either by credit card or by invoice; including those that are currently
in promotional periods.
Years Ended December 31,
200 1
200 0199 9199 819 9 7
Years Ended December 31,
200 1
200 0199 9199 819 9 7
31
XM SATELLiTE RADiO 2 001 Annual Report
81690_XM2001_AR_Financials 4/9/02 12:32 PM Page 13