Westjet 2009 Annual Report Download - page 46
Download and view the complete annual report
Please find page 46 of the 2009 Westjet annual report below. You can navigate through the pages in the report by either clicking on the pages listed below, or by using the keyword search tool below to find specific information within the annual report.-
 1
1 -
2
-
3
-
4
-
5
-
6
-
7
-
8
-
9
-
10
-
11
-
12
-
13
-
14
-
15
-
16
-
17
-
18
-
19
-
20
-
21
-
22
-
23
-
24
-
25
-
26
-
27
-
28
-
29
-
30
-
31
-
32
-
33
-
34
-
35
-
 36
36 -
 37
37 -
 38
38 -
 39
39 -
 40
40 -
 41
41 -
 42
42 -
 43
43 -
 44
44 -
 45
45 -
 46
46 -
 47
47 -
 48
48 -
 49
49 -
 50
50 -
 51
51 -
 52
52 -
 53
53 -
 54
54 -
 55
55 -
 56
56 -
57
-
58
-
59
-
60
-
61
-
62
-
63
-
64
-
65
-
66
-
67
-
68
-
69
-
70
-
71
-
72
-
73
-
74
-
75
-
76
-
77
-
78
-
79
-
80
-
81
-
82
-
83
-
84
-
85
-
86
-
87
-
88
-
89
-
90
-
91
-
92
-
93
-
94
-
95
-
96
-
97
-
98
-
99
-
100
-
101
-
102
-
103
-
104
-
105
-
106
-
107
-
108
-
109
-
110
-
111
-
112
 |
 |
16 WestJet 2009 Annual Report
under cash fl ow hedge accounting are recorded in non-operating
income (expense).
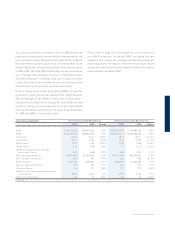
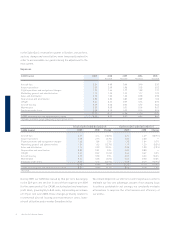
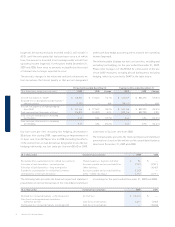
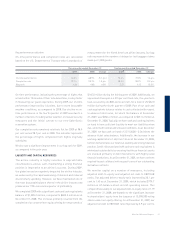
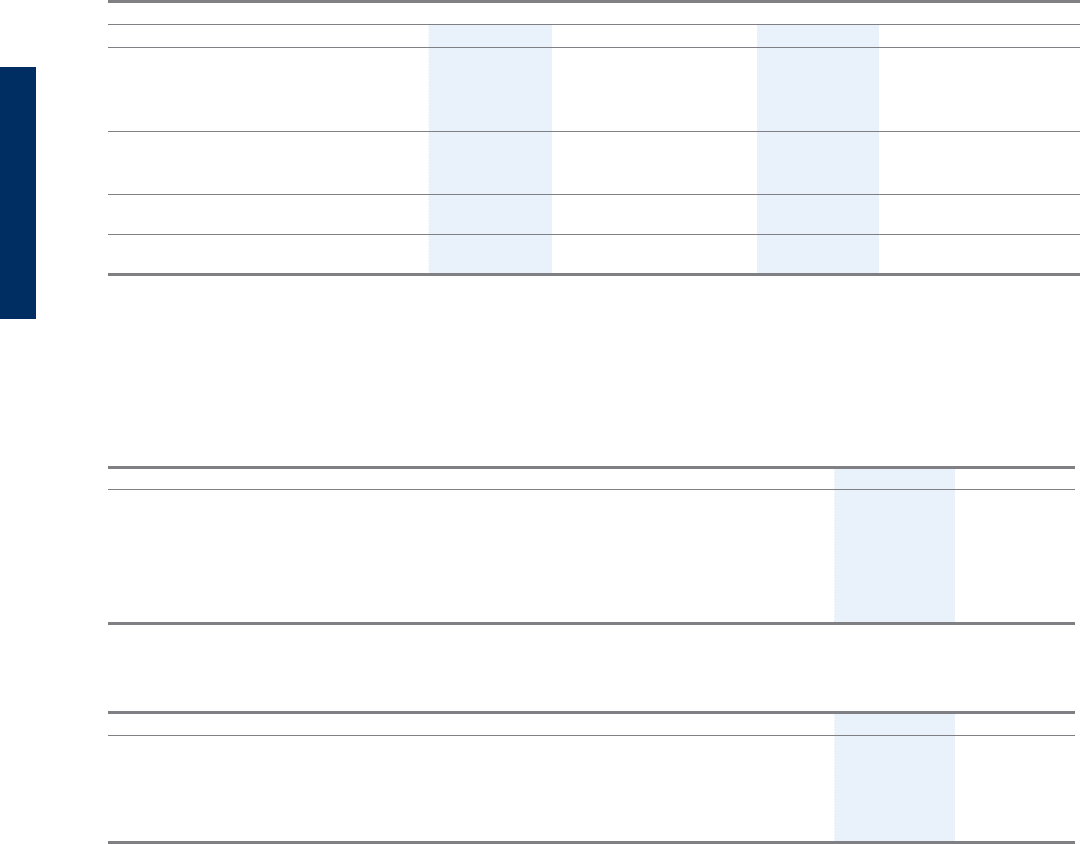
The following table displays our fuel costs per litre, including and
excluding fuel hedging, for the year ended December 31, 2009.
Please refer to page 41 of this MD&A for a discussion on the use
of non-GAAP measures, including aircraft fuel expense, excluding
hedging, which is reconciled to GAAP in the table below.
a decrease of 34.4 per cent from 2008.
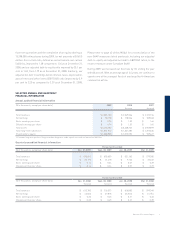
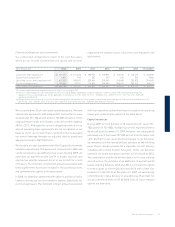
The following table presents the fi nancial impact and statement
presentation of our fuel derivatives on the consolidated balance
sheet as at December 31, 2009 and 2008.
(expense). Amounts previously recorded in AOCL will remain in
AOCL until the anticipated jet fuel purchase occurs, at which
time, the amount is recorded in net earnings under aircraft fuel
operating income (expense). For the years ended December 31,
2009 and 2008, there were no amounts reclassifi ed as the result
of transactions no longer expected to occur.
The periodic changes in fair value and realized settlements on
fuel derivatives that do not qualify or that are not designated
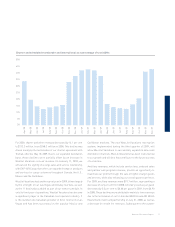
Our fuel costs per litre, including fuel hedging, decreased to
$0.66 per litre during 2009, representing an improvement of
31.3 per cent, from $0.96 per litre in 2008. Excluding the effects
of the realized loss on fuel derivatives designated in an effective
hedging relationship, our fuel costs per litre were $0.63 for 2009,
Three months ended December 31 Twelve months ended December 31
($ in thousands, except per litre data) 2009 2008 Change 2009 2008 Change
Aircraft fuel expense – GAAP $ 148,853 $ 177,422 (16.1%) $ 570,569 $ 803,293 (29.0%)
Realized loss on designated fuel derivatives –
effective portion (3,707) — N/A (28,411) — N/A
Aircraft fuel expense, excluding hedging –
Non-GAAP $ 145,146 $ 177,422 (18.2%) $ 542,158 $ 803,293 (32.5%)
Fuel consumption (thousands of litres) 216,872 210,090 3.2% 859,116 839,700 2.3%
Fuel costs per litre (dollars) – including
fuel hedging 0.69 0.84 (17.9%) 0.66 0.96 (31.3%)
Fuel costs per litre (dollars) – excluding
fuel hedging 0.67 0.84 (20.2%) 0.63 0.96 (34.4%)
($ in thousands) Statement presentation 2009 2008
Receivable from counterparties for settled fuel contracts Prepaid expenses, deposits and other $ 96 $ —
Fair value of fuel derivatives – current portion Accounts payable and accrued liabilities (7,521) (37,811)
Fair value of fuel derivatives – long-term portion Other liabilities — (14,487)
Payable to counterparties for settled fuel contracts Accounts payable and accrued liabilities (1,242) —
Unrealized loss from fuel derivatives AOCL – before tax impact 6,713 44,711
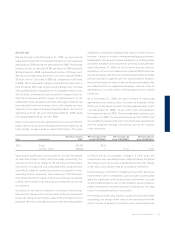
($ in thousands) Statement presentation 2009 2008
Realized loss on fuel derivatives – effective portion Aircraft fuel $ (28,411) $ —
Gain (loss) on designated fuel derivatives –
ineffective portion Gain (loss) on derivatives 5,617 (7,587)
Fair market loss on fuel derivatives not designated Gain (loss) on derivatives — (10,606)
of earnings for the years ended December 31, 2009 and 2008.
The following table presents the fi nancial impact and statement
presentation of our fuel derivatives on the consolidated statement