Westjet 2009 Annual Report Download - page 37
Download and view the complete annual report
Please find page 37 of the 2009 Westjet annual report below. You can navigate through the pages in the report by either clicking on the pages listed below, or by using the keyword search tool below to find specific information within the annual report.-
 1
1 -
2
-
3
-
4
-
5
-
6
-
7
-
8
-
9
-
10
-
11
-
12
-
13
-
14
-
15
-
16
-
17
-
18
-
19
-
20
-
21
-
22
-
23
-
24
-
25
-
26
-
 27
27 -
 28
28 -
 29
29 -
 30
30 -
 31
31 -
 32
32 -
 33
33 -
 34
34 -
 35
35 -
 36
36 -
 37
37 -
 38
38 -
 39
39 -
 40
40 -
 41
41 -
 42
42 -
 43
43 -
 44
44 -
 45
45 -
 46
46 -
 47
47 -
48
-
49
-
50
-
51
-
52
-
53
-
54
-
55
-
56
-
57
-
58
-
59
-
60
-
61
-
62
-
63
-
64
-
65
-
66
-
67
-
68
-
69
-
70
-
71
-
72
-
73
-
74
-
75
-
76
-
77
-
78
-
79
-
80
-
81
-
82
-
83
-
84
-
85
-
86
-
87
-
88
-
89
-
90
-
91
-
92
-
93
-
94
-
95
-
96
-
97
-
98
-
99
-
100
-
101
-
102
-
103
-
104
-
105
-
106
-
107
-
108
-
109
-
110
-
111
-
112
 |
 |

WestJet 2009 Annual Report 7
Our culture and people continued to shine in 2009 despite the
pressures of a weakened economy and the implementation of a
new reservation system. We were recently inducted into Canada’s
Most Admired Corporate Cultures Hall of Fame by Waterstone
Human Capital after being named a winner in their annual survey
in 2005, 2006, 2007 and 2008. Additionally, we were selected as
one of Canada’s Best Employers as part of Hewitt Associates
2010 Best Employers in Canada study. Our enviable corporate
culture has allowed us to remain focused on our longer-term
objectives during this period of economic uncertainty.
Due to a change in accounting policy during 2009, retrospective
restatement of prior periods was required. This change has been
denoted throughout this MD&A. Please refer to Accounting –
Change in Accounting Policies on page 33 of this MD&A, as well
as note 2, change in accounting policies, to the consolidated
fi nancial statements and notes for the years ended December
31, 2009 and 2008, for further disclosure.
Please refer to page 42 of this MD&A for a reconciliation of
non-GAAP measures, including CASM, excluding fuel and
employee profi t share, net earnings and diluted earnings per
share adjusted for the impact of the non-recurring net future
income tax reduction in the fourth quarter of 2009, to the nearest
measure under Canadian GAAP.
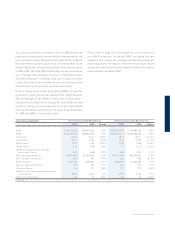
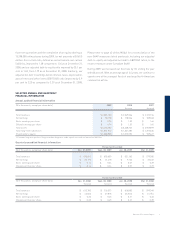
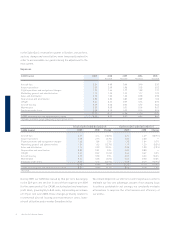
Operational highlights Three months ended December 31 Twelve months ended December 31
2009 2008 Change 2009 2008 Change
ASMs 4,412,573,833 4,288,054,528 2.9% 17,587,640,902 17,138,883,465 2.6%
RPMs 3,460,905,058 3,328,856,003 4.0% 13,834,761,211 13,730,960,234 0.8%
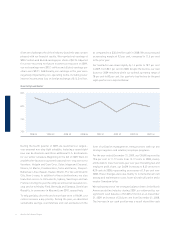
Load factor 78.4% 77.6% 0.8 pts. 78.7% 80.1% (1.4 pts.)
Yield (cents) 16.47 18.50 (11.0%) 16.49 18.57 (11.2%)
RASM (cents) 12.92 14.36 (10.0%) 12.97 14.88 (12.8%)
CASM (cents) 12.10 12.98*(6.8%) 11.77 13.17*(10.6%)
CASM, excluding fuel and employee
profi t share (cents) 8.67 8.68* (0.1%) 8.45 8.29*1.9%
Fuel consumption (litres) 216,871,585 210,090,434 3.2% 859,115,698 839,699,921 2.3%
Fuel costs per litre (dollars) 0.69 0.84 (17.9%) 0.66 0.96 (31.3%)
Segment guests 3,515,168 3,518,362 (0.1%) 14,038,827 14,283,630 (1.7%)
Average stage length (miles) 923 899 2.7% 923 913 1.1%
Utilization (hours) 11.4 12.1 (5.8%) 11.7 12.3 (4.9%)
Number of full-time equivalent employees
at period end 6,291 6,187 1.7% 6,291 6,187 1.7%
Fleet size at period end 86 76 13.2% 86 76 13.2%
*Restated