Westjet 2009 Annual Report Download - page 102
Download and view the complete annual report
Please find page 102 of the 2009 Westjet annual report below. You can navigate through the pages in the report by either clicking on the pages listed below, or by using the keyword search tool below to find specific information within the annual report.-
 1
1 -
2
-
3
-
4
-
5
-
6
-
7
-
8
-
9
-
10
-
11
-
12
-
13
-
14
-
15
-
16
-
17
-
18
-
19
-
20
-
21
-
22
-
23
-
24
-
25
-
26
-
27
-
28
-
29
-
30
-
31
-
32
-
33
-
34
-
35
-
36
-
37
-
38
-
39
-
40
-
41
-
42
-
43
-
44
-
45
-
46
-
47
-
48
-
49
-
50
-
51
-
52
-
53
-
54
-
55
-
56
-
57
-
58
-
59
-
60
-
61
-
62
-
63
-
64
-
65
-
66
-
67
-
68
-
69
-
70
-
71
-
72
-
73
-
74
-
75
-
76
-
77
-
78
-
79
-
80
-
81
-
82
-
83
-
84
-
85
-
86
-
87
-
88
-
89
-
90
-
91
-
 92
92 -
 93
93 -
 94
94 -
 95
95 -
 96
96 -
 97
97 -
 98
98 -
 99
99 -
 100
100 -
 101
101 -
 102
102 -
 103
103 -
 104
104 -
 105
105 -
 106
106 -
 107
107 -
 108
108 -
 109
109 -
 110
110 -
 111
111 -
 112
112
 |
 |

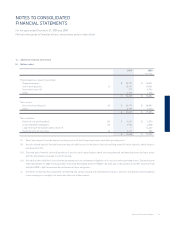
72 WestJet 2009 Annual Report
NOTES TO CONSOLIDATED
FINANCIAL STATEMENTS
For the years ended December 31, 2009 and 2008
(Stated in thousands of Canadian dollars, except share and per share data)
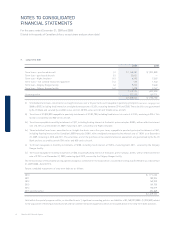
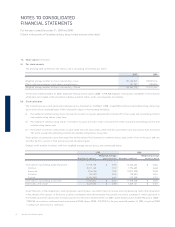
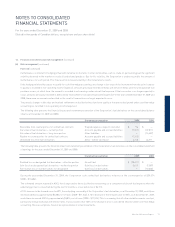
Fair value Amortized cost Totals
2008
Held-for-
trading Derivatives
Loans and
receivables
Other fi nancial
liabilities
Carrying
amount
Fair
value
Asset (liability)
Cash and cash equivalents $ 820,214 $ — $ — $ — $ 820,214 $ 820,214
Accounts receivable — — 16,837 — 16,837 16,837
Foreign exchange derivatives (i) — 6,735 — — 6,735 6,735
Fuel derivatives (ii) — (52,298) — — (52,298) (52,298)
Deposits (iii) 24,309 — — — 24,309 24,309
Accounts payable and accrued
liabilities (iv) —— — (211,543) (211,543) (211,543)
Long-term debt (v) — — — (1,351,903) (1,351,903) (1,515,487)
Obligations under capital leases (vi) — — — (1,108) (1,108) (1,108)
$ 844,523 $ (45,563) $ 16,837 $ (1,564,554) $ (748,757) $ (912,341)
(i) Includes $181 (2008 – $6,735) classifi ed in prepaid expenses, deposits and other and $1,430 (2008 – $nil) classifi ed in accounts payable and accrued liabilities.
(ii) Includes $96 (2008 – $nil) classifi ed in prepaid expenses, deposits and other, $8,763 (2008 – $37,811) classifi ed in accounts payable and accrued liabilities and $nil
(2008 – $14,487) classifi ed in other liabilities.
(iii) Includes $11,249 (2008 – $404) classifi ed in prepaid expenses, deposits and other and $16,015 (2008 – $23,905) classifi ed in other assets.
(iv) Excludes fuel-derivative liabilities of $8,763 (2008 – $37,811) and foreign exchange derivative liabilities of $1,430 (2008 – $nil).
(v) Includes current portion of long-term debt of $171,223 (2008 – $165,721) and long-term portion of $1,048,554 (2008 – $1,186,182).
(vi) Includes current portion of obligations under capital leases of $744 (2008 – $395) and long-term portion of $3,358 (2008 – $713).
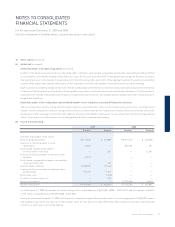
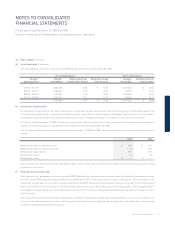
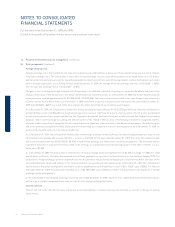
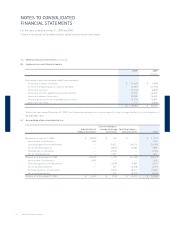
13. Financial instruments and risk management (continued)
(a) Fair value of fi nancial assets and fi nancial liabilities (continued)
Section 3862, Financial Instruments – Disclosures, requires an explanation about how fair value is determined for assets and liabilities measured
in the fi nancial statements at fair value and establishes a hierarchy for which these assets and liabilities must be grouped, based on signifi cant
levels of input as follows:
Level 1: observable inputs such as quoted prices in active markets;
Level 2: inputs, other than the quoted market prices in active markets, which are observable, either directly and/or indirectly; and
Level 3: unobservable inputs for the asset or liability in which little or no market data exists, therefore requiring an entity to develop its
own assumptions.
The following items, shown in the consolidated balance sheet as at December 31, 2009 and 2008, are measured at fair value on a recurring basis
using level 1, level 2 or level 3 inputs:
2009 Level 1 Level 2 Level 3 Total
Asset (liability):
Cash and cash equivalents $ 1,005,181 $ — $ — $ 1,005,181
Foreign exchange derivatives — (1,249) — (1,249)
Fuel derivatives — (8,667) — (8,667)
Deposits 27,264 — — 27,264
$ 1,032,445 $ (9,916) $ — $ 1,022,529