Westjet 2009 Annual Report Download - page 42
Download and view the complete annual report
Please find page 42 of the 2009 Westjet annual report below. You can navigate through the pages in the report by either clicking on the pages listed below, or by using the keyword search tool below to find specific information within the annual report.-
 1
1 -
2
-
3
-
4
-
5
-
6
-
7
-
8
-
9
-
10
-
11
-
12
-
13
-
14
-
15
-
16
-
17
-
18
-
19
-
20
-
21
-
22
-
23
-
24
-
25
-
26
-
27
-
28
-
29
-
30
-
31
-
 32
32 -
 33
33 -
 34
34 -
 35
35 -
 36
36 -
 37
37 -
 38
38 -
 39
39 -
 40
40 -
 41
41 -
 42
42 -
 43
43 -
 44
44 -
 45
45 -
 46
46 -
 47
47 -
 48
48 -
 49
49 -
 50
50 -
 51
51 -
 52
52 -
53
-
54
-
55
-
56
-
57
-
58
-
59
-
60
-
61
-
62
-
63
-
64
-
65
-
66
-
67
-
68
-
69
-
70
-
71
-
72
-
73
-
74
-
75
-
76
-
77
-
78
-
79
-
80
-
81
-
82
-
83
-
84
-
85
-
86
-
87
-
88
-
89
-
90
-
91
-
92
-
93
-
94
-
95
-
96
-
97
-
98
-
99
-
100
-
101
-
102
-
103
-
104
-
105
-
106
-
107
-
108
-
109
-
110
-
111
-
112
 |
 |

12 WestJet 2009 Annual Report
The decrease in yield was attributable to aggressive pricing by
the airline industry to stimulate air travel, and, to a lesser extent,
the absence of the fuel surcharge in place during a portion
of 2008.
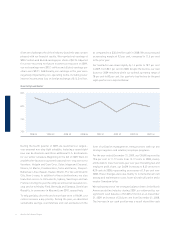
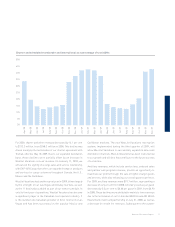
During 2009, we reduced our aircraft utilization to optimize our
schedule to better match the weakened demand environment.
As such, average aircraft utilization decreased by 36 minutes to
11.7 operating hours per day, compared to 12.3 operating hours
per day in 2008. The fl exibility of our fl eet-deployment strategy
allows us to react to demand changes by adjusting our schedule
for more profi table fl ying. During the year, we continued with
tactical adjustments to our schedule in favour of transborder
and international markets, as depicted in the following graph.
Additionally, we eliminated certain red-eye fl ights and reduced
frequency of fl ights into a number of less profi table markets
during the year. Our lower aircraft utilization negatively impacts
CASM and revenue.
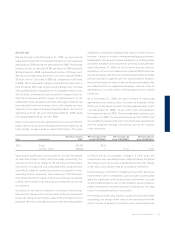
Income taxes
Our effective consolidated income tax rate for the three months
ended December 31, 2009 was 12.4 per cent, as compared to 30.1
per cent for the same period in 2008. The signifi cant decrease
in our effective tax rate for the three-month period ended
December 31, 2009, was primarily due to a corporate income
tax rate reduction enacted by the Ontario provincial government,
offset partially by revisions to the measurement of previously
recognized future tax assets. Excluding this net $5.1 million
favourable reduction of future income tax expense, our effective
consolidated income tax rate for the quarter would have been
34.3 per cent, which is higher than expected due to the portion
of non-deductible matching contributions under our Employee
Share Purchase Plan (ESPP) realized in the fourth quarter.
During 2009, total revenues decreased by 10.5 per cent
to $2,281.1 million from $2,549.5 million in 2008, largely
attributable to a decline in guest revenues from our scheduled
fl ight operations. Guest revenues decreased in 2009 by 10.1 per
cent to $2,067.9 million, as compared to $2,301.3 million in 2008,
mainly due to the weak economy, and, to a lesser extent, the
elimination of the fuel surcharge that was implemented in the
second quarter of 2008. For 2009, we saw increased seat sales
and fare discounts in order to stimulate demand amid the weak
economic environment. This decrease was offset somewhat by
growth in WestJet Vacations air revenue.
One of our key revenue measurements is RASM, as it takes into
consideration load factor and yield. Our RASM decreased by 12.8
per cent to 12.97 cents for 2009, compared to 14.88 cents in
2008. This change was primarily due to a decline in yield of 11.2
per cent for 2009, as well as a slightly lower 2009 load factor.
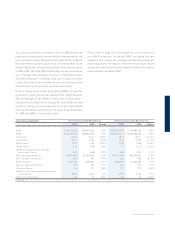
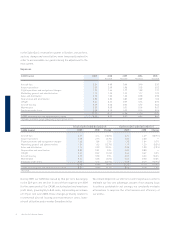
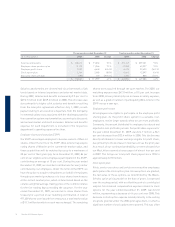
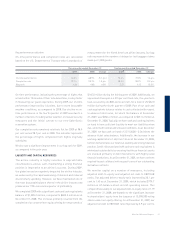
RESULTS OF OPERATIONS
Revenue
Three months ended December 31 Twelve months ended December 31
($ in thousands) 2009 2008 Change 2009 2008 Change
Guest revenues $ 528,104 $ 561,514 (5.9%) $ 2,067,860 $ 2,301,301 (10.1%)
Charter and other revenues 41,938 54,269 (22.7%) 213,260 248,205 (14.1%)
$ 570,042 $ 615,783 (7.4%) $ 2,281,120 $ 2,549,506 (10.5%)
RASM (cents) 12.92 14.36 (10.0%) 12.97 14.88 (12.8%)