Westjet 2009 Annual Report Download - page 36
Download and view the complete annual report
Please find page 36 of the 2009 Westjet annual report below. You can navigate through the pages in the report by either clicking on the pages listed below, or by using the keyword search tool below to find specific information within the annual report.-
 1
1 -
2
-
3
-
4
-
5
-
6
-
7
-
8
-
9
-
10
-
11
-
12
-
13
-
14
-
15
-
16
-
17
-
18
-
19
-
20
-
21
-
22
-
23
-
24
-
25
-
 26
26 -
 27
27 -
 28
28 -
 29
29 -
 30
30 -
 31
31 -
 32
32 -
 33
33 -
 34
34 -
 35
35 -
 36
36 -
 37
37 -
 38
38 -
 39
39 -
 40
40 -
 41
41 -
 42
42 -
 43
43 -
 44
44 -
 45
45 -
 46
46 -
47
-
48
-
49
-
50
-
51
-
52
-
53
-
54
-
55
-
56
-
57
-
58
-
59
-
60
-
61
-
62
-
63
-
64
-
65
-
66
-
67
-
68
-
69
-
70
-
71
-
72
-
73
-
74
-
75
-
76
-
77
-
78
-
79
-
80
-
81
-
82
-
83
-
84
-
85
-
86
-
87
-
88
-
89
-
90
-
91
-
92
-
93
-
94
-
95
-
96
-
97
-
98
-
99
-
100
-
101
-
102
-
103
-
104
-
105
-
106
-
107
-
108
-
109
-
110
-
111
-
112
 |
 |

6 WestJet 2009 Annual Report
Defi nition of key operating indicators
Our key operating indicators are airline industry metrics,
which are useful in assessing the operating performance of an
airline.
Flight leg: A segment of a fl ight involving a stopover, change of
aircraft or change of airline from one landing site to another.
Segment guest: Any person who has been booked to occupy a
seat on a fl ight leg and is not a member of the crew assigned
to the fl ight.
Average stage length: The average distance of a non-stop fl ight
leg between take-off and landing as defi ned by International Air
Transport Association (IATA) guidelines.
Available seat miles (ASMs): A measure of total guest capacity,
calculated by multiplying the number of seats available for guest
use in an aircraft by stage length.
Revenue passenger miles (RPMs): A measure of guest traffi c,
calculated by multiplying the number of segment guests by
stage length.
Load factor: A measure of total capacity utilization, calculated by
dividing revenue passenger miles by total available seat miles.
Yield (revenue per revenue passenger mile): A measure of unit
revenue, calculated as the gross revenue generated per revenue
passenger mile.
Revenue per available seat mile (RASM): Total revenues divided
by available seat miles.
Cost per available seat mile (CASM): Operating expenses divided
by available seat miles.
Cycle: One fl ight, counted by the aircraft leaving the ground
and landing.
Utilization: Operating hours per day per operating aircraft.
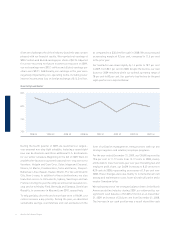
OVERVIEW
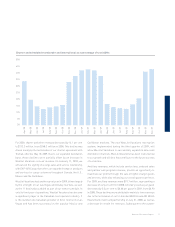
2009 was an extremely challenging year for the airline industry.
The economic recession, which took hold in the latter part of
2008 and continued in 2009, resulted in a severe drop in demand
for air travel, and the industry was forced to slash both pricing
and, in many cases, capacity. This resulted in one of the worst
business environments the airline industry has experienced
and, accordingly, contributed to our signifi cant year-over-year
RASM decline. Despite these challenges, our fourth-quarter
financial results represent our 19th consecutive quarter of
profi tability. During 2009, we generated positive cash fl ows
from operations, increased our cash balance and maintained
one of the best balance sheets in the North American airline
industry, all the while building future value through the
expansion of WestJet Vacations and the implementation of our
new reservation systems. Our continued commitment to growth
was also demonstrated through the delivery of 10 new aircraft,
our increase in capacity of 2.6 per cent and the introduction of a
record 15 new destinations. With our earnings before tax (EBT)
margin of 6.0 per cent, we once again produced one of the best
EBT margins of any large North American airline.
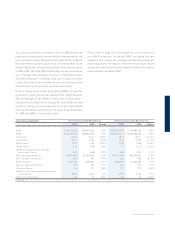
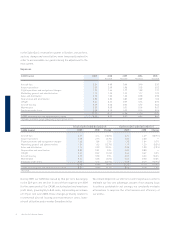
2009 highlights
• Recognized total revenues of $2.3 billion, a decrease of 10.5
per cent from 2008.
• Recorded RASM of 12.97 cents, down 12.8 per cent
from 2008.
• Increased capacity by 2.6 per cent over 2008.
• Reduced CASM to 11.77 cents from 13.17 cents in 2008, a
decrease of 10.6 per cent.
• Realized CASM, excluding fuel and employee profi t share,
of 8.45 cents for 2009, up 1.9 per cent over 2008.
• Recorded an EBT margin of 6.0 per cent in 2009, down 4.0
points from 2008.
• Realized net earnings of $98.2 million, a decrease of 45.0
per cent from 2008.
• Realized diluted earnings per share of $0.74 for 2009, a
decrease of 46.0 per cent compared to 2008.
• Adjusted for a non-recurring net future income tax reduction
during 2009, we recorded a net earnings decrease of 47.8
per cent to $93.1 million in 2009 from $178.5 million in 2008,
and a diluted earnings per share decrease of 48.2 per cent
to $0.71 from $1.37 in 2008.
• Generated cash fl ows from operations of $318.7 million, a
decrease from $460.6 million in 2008.