Rite Aid 2014 Annual Report Download - page 90
Download and view the complete annual report
Please find page 90 of the 2014 Rite Aid annual report below. You can navigate through the pages in the report by either clicking on the pages listed below, or by using the keyword search tool below to find specific information within the annual report.-
 1
1 -
2
-
3
-
4
-
5
-
6
-
7
-
8
-
9
-
10
-
11
-
12
-
13
-
14
-
15
-
16
-
17
-
18
-
19
-
20
-
21
-
22
-
23
-
24
-
25
-
26
-
27
-
28
-
29
-
30
-
31
-
32
-
33
-
34
-
35
-
36
-
37
-
38
-
39
-
40
-
41
-
42
-
43
-
44
-
45
-
46
-
47
-
48
-
49
-
50
-
51
-
52
-
53
-
54
-
55
-
56
-
57
-
58
-
59
-
60
-
61
-
62
-
63
-
64
-
65
-
66
-
67
-
68
-
69
-
70
-
71
-
72
-
73
-
74
-
75
-
76
-
77
-
78
-
79
-
 80
80 -
 81
81 -
 82
82 -
 83
83 -
 84
84 -
 85
85 -
 86
86 -
 87
87 -
 88
88 -
 89
89 -
 90
90 -
 91
91 -
 92
92 -
 93
93 -
 94
94 -
 95
95 -
 96
96 -
 97
97 -
 98
98 -
 99
99 -
 100
100 -
101
-
102
-
103
-
104
-
105
-
106
-
107
-
108
-
109
-
110
-
111
-
112
-
113
-
114
-
115
-
116
-
117
-
118
-
119
-
120
-
121
-
122
 |
 |

RITE AID CORPORATION AND SUBSIDIARIES
NOTES TO CONSOLIDATED FINANCIAL STATEMENTS (Continued)
For the Years Ended March 1, 2014, March 2, 2013 and March 3, 2012
(In thousands, except per share amounts)
12. Leases (Continued)
During fiscal 2012, the Company sold two owned operating stores to independent third parties.
Net proceeds from the sale were $6,038. Concurrent with these sales, the Company entered into
agreements to lease the stores back from the purchasers over a minimum lease term of 7 to 10 years.
The Company accounted for these leases as operating leases. The transactions resulted in a loss of
$3,896 which is included in the gain on sale of assets, net for the fifty-three weeks ended March 3,
2012.
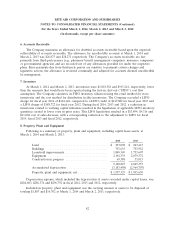
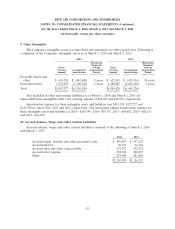
The net book values of assets under capital leases and sale-leasebacks accounted for under the
financing method at March 1, 2014 and March 2, 2013 are summarized as follows:
2014 2013
Land......................................... $ 5,063 $ 6,692
Buildings ...................................... 135,581 137,206
Leasehold improvements ........................... 1,446 1,691
Equipment ..................................... 34,305 21,316
Accumulated depreciation .......................... (113,536) (103,381)
$ 62,859 $ 63,524
Following is a summary of lease finance obligations at March 1, 2014 and March 2, 2013:
2014 2013
Obligations under financing leases ..................... $102,671 $107,308
Sale-leaseback obligations ........................... 4,740 7,876
Less current obligation ............................. (32,240) (23,334)
Long-term lease finance obligations .................... $ 75,171 $ 91,850
Following are the minimum lease payments for all properties under a lease agreement that will
have to be made in each of the years indicated based on non-cancelable leases in effect as of March 1,
2014:
Lease Financing Operating
Fiscal year Obligations Leases
2015 ...................................... $ 40,030 $ 996,495
2016 ...................................... 21,228 953,607
2017 ...................................... 19,330 892,261
2018 ...................................... 13,496 810,267
2019 ...................................... 12,370 713,914
Later years ................................. 33,656 3,405,091
Total minimum lease payments ................... 140,110 $7,771,635
Amount representing interest .................... (32,699)
Present value of minimum lease payments ........... $107,411
89