Rite Aid 2014 Annual Report Download - page 39
Download and view the complete annual report
Please find page 39 of the 2014 Rite Aid annual report below. You can navigate through the pages in the report by either clicking on the pages listed below, or by using the keyword search tool below to find specific information within the annual report.-
 1
1 -
2
-
3
-
4
-
5
-
6
-
7
-
8
-
9
-
10
-
11
-
12
-
13
-
14
-
15
-
16
-
17
-
18
-
19
-
20
-
21
-
22
-
23
-
24
-
25
-
26
-
27
-
28
-
 29
29 -
 30
30 -
 31
31 -
 32
32 -
 33
33 -
 34
34 -
 35
35 -
 36
36 -
 37
37 -
 38
38 -
 39
39 -
 40
40 -
 41
41 -
 42
42 -
 43
43 -
 44
44 -
 45
45 -
 46
46 -
 47
47 -
 48
48 -
 49
49 -
50
-
51
-
52
-
53
-
54
-
55
-
56
-
57
-
58
-
59
-
60
-
61
-
62
-
63
-
64
-
65
-
66
-
67
-
68
-
69
-
70
-
71
-
72
-
73
-
74
-
75
-
76
-
77
-
78
-
79
-
80
-
81
-
82
-
83
-
84
-
85
-
86
-
87
-
88
-
89
-
90
-
91
-
92
-
93
-
94
-
95
-
96
-
97
-
98
-
99
-
100
-
101
-
102
-
103
-
104
-
105
-
106
-
107
-
108
-
109
-
110
-
111
-
112
-
113
-
114
-
115
-
116
-
117
-
118
-
119
-
120
-
121
-
122
 |
 |
2012 Transactions
In February 2012, $404.8 million aggregate principal amount of the outstanding 8.625% notes were
tendered and repurchased by us. We redeemed the remaining 8.625% notes in March 2012 for
$55.6 million, which included the call premium and interest through the redemption date. The
refinancing resulted in an aggregate loss on debt retirement of $16.1 million recorded in the fourth
quarter of fiscal 2012.
During August 2011, we repurchased $41.0 million of our 8.625% notes, $5.0 million of our
9.375% notes and $4.5 million of our 6.875% debentures. These repurchases resulted in a gain for the
period of $5.0 million.
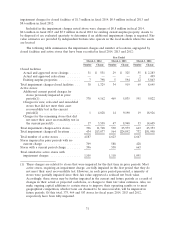
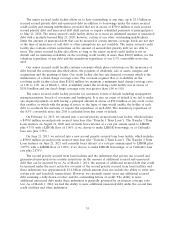
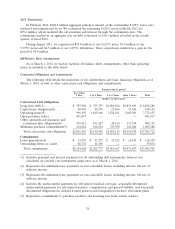
Off-Balance Sheet Arrangements
As of March 1, 2014, we had no material off balance sheet arrangements, other than operating
leases as included in the table below.
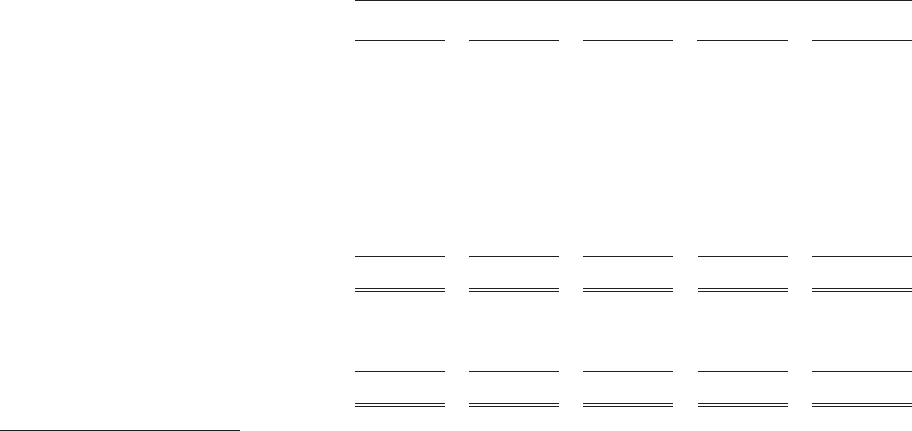
Contractual Obligations and Commitments
The following table details the maturities of our indebtedness and lease financing obligations as of
March 1, 2014, as well as other contractual cash obligations and commitments.
Payment due by period
Less Than
1 Year 1 to 3 Years 3 to 5 Years After 5 Years Total
(Dollars in thousands)
Contractual Cash Obligations
Long term debt(1) .............. $ 355,894 $ 755,735 $1,086,962 $5,839,689 $ 8,038,280
Capital lease obligations(2) ........ 40,030 40,558 25,866 33,656 140,110
Operating leases(3) ............. 996,495 1,845,868 1,524,181 3,405,091 7,771,635
Open purchase orders ........... 401,817 — — — 401,817
Other, primarily self insurance and
retirement plan obligations(4) .... 102,411 142,427 48,156 115,198 408,192
Minimum purchase commitments(5) . 164,844 364,854 333,950 162,040 1,025,688
Total contractual cash obligations . $2,061,491 $3,149,442 $3,019,115 $9,555,674 $17,785,722
Commitments
Lease guarantees(6) ............. $ 24,339 $ 45,235 $ 32,352 $ 16,183 $ 118,109
Outstanding letters of credit ....... 68,774 11,100 — — 79,874
Total commitments ............ $2,154,604 $3,205,777 $3,051,467 $9,571,857 $17,983,705
(1) Includes principal and interest payments for all outstanding debt instruments. Interest was
calculated on variable rate instruments using rates as of March 1, 2014.
(2) Represents the minimum lease payments on non-cancelable leases, including interest, but net of
sublease income.
(3) Represents the minimum lease payments on non-cancelable leases, including interest, but net of
sublease income.
(4) Includes the undiscounted payments for self-insured medical coverage, actuarially determined
undiscounted payments for self-insured workers’ compensation and general liability, and actuarially
determined obligations for defined benefit pension and nonqualified executive retirement plans.
(5) Represents commitments to purchase products and licensing fees from certain vendors.
38