Rite Aid 2014 Annual Report Download - page 27
Download and view the complete annual report
Please find page 27 of the 2014 Rite Aid annual report below. You can navigate through the pages in the report by either clicking on the pages listed below, or by using the keyword search tool below to find specific information within the annual report.
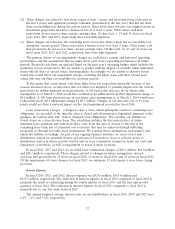
Income Tax: Net income for fiscal 2014 included income tax expense of $0.8 million, compared to
income tax benefit of $110.6 million for fiscal 2013. Income tax expense for fiscal 2014 resulted in an
increase in the deferred tax valuation allowance to offset the windfall tax benefits recorded in
additional paid-in capital (‘‘APIC’’) pursuant to the tax law ordering approach, offset by adjustments to
unrecognized tax benefits due to the lapse of statute of limitations. The benefit recognized in fiscal
2013 was primarily comprised of recognition of previously unrecognized tax benefits resulting from the
Internal Revenue Service (‘‘IRS’’) and Commonwealth of Massachusetts Appellate Divisions
settlements related to the examinations of the Brooks Eckerd fiscal years 2004 - 2007 and fiscal years
2005 - 2007, respectively. This amount was offset by a reversal of the related tax indemnification asset
which was recorded in selling, general and administrative expenses as these audits were related to
pre-acquisition periods. Additionally, the income tax expense for 2014 and benefit for 2013 was
recorded net of adjustments to maintain a full valuation allowance against our net deferred tax assets.
We maintain a full valuation allowance against the net deferred tax assets as a result of a three
year cumulative loss position as of March 1, 2014. ASC 740, ‘‘Income Taxes’’ requires a company to
evaluate its deferred tax assets on a regular basis to determine if a valuation allowance against the net
deferred tax assets is required. A cumulative loss in recent years is significant negative evidence in
considering whether deferred tax assets are realizable. Based on the negative evidence, ASC 740
precludes relying on projections of future taxable income to support the recognition of deferred tax
assets.
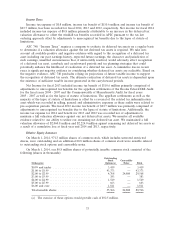
Results of Operations
Revenue and Other Operating Data
Year Ended
March 1, March 2, March 3,
2014 2013 2012
(52 Weeks) (52 Weeks) (53 Weeks)
(Dollars in thousands)
Revenues ........................... $25,526,413 $25,392,263 $26,121,222
Revenue growth (decline) ............... 0.5% (2.8)% 3.6%
Same store sales growth (decline) .......... 0.7% (0.3)% 2.0%
Pharmacy sales growth (decline) ........... 0.9% (1.6)% 1.9%
Same store prescription count (decrease)
increase .......................... (0.3)% 3.4% 0.9%
Same store pharmacy sales growth (decline) . . 1.2% (1.0)% 2.4%
Pharmacy sales as a % of total sales ........ 67.9% 67.6% 68.1%
Third party sales as a % of total pharmacy
sales ............................. 97.0% 96.6% 96.5%
Front-end sales (decline) growth .......... (0.4)% 0.8% 0.7%
Same store front-end sales (decline) growth . . . (0.2)% 1.4% 1.1%
Front-end sales as a % of total sales ........ 32.1% 32.4% 31.9%
Adjusted EBITDA(*) .................. $ 1,324,959 $ 1,128,379 $ 942,902
Store data:
Total stores (beginning of period) ........ 4,623 4,667 4,714
New stores ........................ — — —
Store acquisitions ................... 1 — —
Closed stores ...................... (37) (44) (47)
Total stores (end of period) ............ 4,587 4,623 4,667
Relocated stores .................... 11 13 15
Remodeled and expanded stores ......... 409 516 279
(*) See Adjusted EBITDA and Other Non-GAAP Measures for additional details
26


