Rite Aid 2014 Annual Report Download - page 75
Download and view the complete annual report
Please find page 75 of the 2014 Rite Aid annual report below. You can navigate through the pages in the report by either clicking on the pages listed below, or by using the keyword search tool below to find specific information within the annual report.-
 1
1 -
2
-
3
-
4
-
5
-
6
-
7
-
8
-
9
-
10
-
11
-
12
-
13
-
14
-
15
-
16
-
17
-
18
-
19
-
20
-
21
-
22
-
23
-
24
-
25
-
26
-
27
-
28
-
29
-
30
-
31
-
32
-
33
-
34
-
35
-
36
-
37
-
38
-
39
-
40
-
41
-
42
-
43
-
44
-
45
-
46
-
47
-
48
-
49
-
50
-
51
-
52
-
53
-
54
-
55
-
56
-
57
-
58
-
59
-
60
-
61
-
62
-
63
-
64
-
 65
65 -
 66
66 -
 67
67 -
 68
68 -
 69
69 -
 70
70 -
 71
71 -
 72
72 -
 73
73 -
 74
74 -
 75
75 -
 76
76 -
 77
77 -
 78
78 -
 79
79 -
 80
80 -
 81
81 -
 82
82 -
 83
83 -
 84
84 -
 85
85 -
86
-
87
-
88
-
89
-
90
-
91
-
92
-
93
-
94
-
95
-
96
-
97
-
98
-
99
-
100
-
101
-
102
-
103
-
104
-
105
-
106
-
107
-
108
-
109
-
110
-
111
-
112
-
113
-
114
-
115
-
116
-
117
-
118
-
119
-
120
-
121
-
122
 |
 |
RITE AID CORPORATION AND SUBSIDIARIES
NOTES TO CONSOLIDATED FINANCIAL STATEMENTS (Continued)
For the Years Ended March 1, 2014, March 2, 2013 and March 3, 2012
(In thousands, except per share amounts)
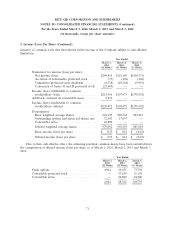
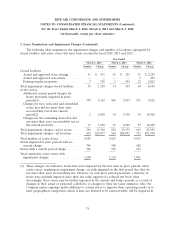
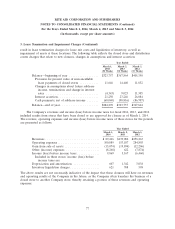
3. Lease Termination and Impairment Charges (Continued)
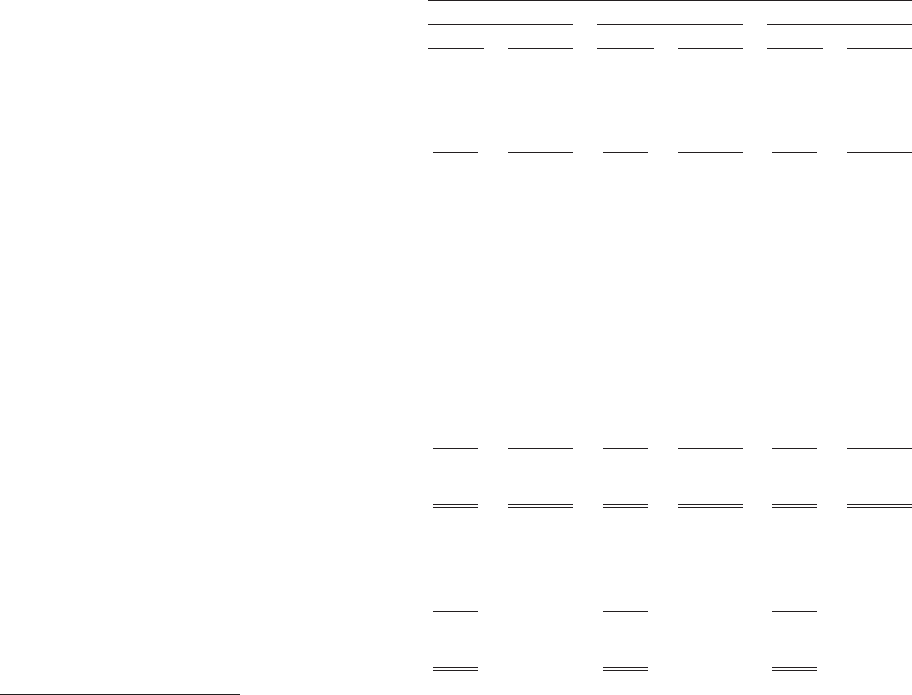
The following table summarizes the impairment charges and number of locations, segregated by
closed facilities and active stores that have been recorded in fiscal 2014, 2013 and 2012:
Year Ended
March 1, 2014 March 2, 2013 March 3, 2012
Number Charge Number Charge Number Charge
Closed facilities:
Actual and approved store closings ...... 31 $ 531 29 $ 325 55 $ 2,283
Actual and approved relocations ........ — — — — 2 499
Existing surplus properties ............ 7 798 5 594 12 5,863
Total impairment charges-closed facilities . . . 38 1,329 34 919 69 8,645
Active stores:
Additional current period charges for
stores previously impaired in prior
periods(1) ....................... 378 4,162 469 5,835 591 9,822
Charges for new, relocated and remodeled
stores that did not meet their asset
recoverability test in the current
period(2) ....................... 1 4,028 14 9,190 19 18,926
Charges for the remaining stores that did
not meet their asset recoverability test in
the current period(3) ............... 17 3,558 47 8,948 53 14,605
Total impairment charges—active stores .... 396 11,748 530 23,973 663 43,353
Total impairment charges—all locations ..... 434 $13,077 564 $24,892 732 $51,998
Total number of active stores ............ 4,587 4,623 4,667
Stores impaired in prior periods with no
current charge ..................... 709 588 428
Stores with a current period charge ........ 396 530 663
Total cumulative active stores with
impairment charges ................. 1,105 1,118 1,091
(1) These charges are related to stores that were impaired for the first time in prior periods. Most
active stores, requiring an impairment charge, are fully impaired in the first period that they do
not meet their asset recoverability test. However, in each prior period presented, a minority of
stores were partially impaired since their fair value supported a reduced net book value.
Accordingly, these stores may be further impaired in the current and future periods as a result of
changes in their actual or projected cash flows, or changes to their fair value estimates. Also, the
Company makes ongoing capital additions to certain stores to improve their operating results or to
meet geographical competition, which if later are deemed to be unrecoverable, will be impaired in
74