Rite Aid 2014 Annual Report Download - page 24
Download and view the complete annual report
Please find page 24 of the 2014 Rite Aid annual report below. You can navigate through the pages in the report by either clicking on the pages listed below, or by using the keyword search tool below to find specific information within the annual report.-
 1
1 -
2
-
3
-
4
-
5
-
6
-
7
-
8
-
9
-
10
-
11
-
12
-
13
-
 14
14 -
 15
15 -
 16
16 -
 17
17 -
 18
18 -
 19
19 -
 20
20 -
 21
21 -
 22
22 -
 23
23 -
 24
24 -
 25
25 -
 26
26 -
 27
27 -
 28
28 -
 29
29 -
 30
30 -
 31
31 -
 32
32 -
 33
33 -
 34
34 -
35
-
36
-
37
-
38
-
39
-
40
-
41
-
42
-
43
-
44
-
45
-
46
-
47
-
48
-
49
-
50
-
51
-
52
-
53
-
54
-
55
-
56
-
57
-
58
-
59
-
60
-
61
-
62
-
63
-
64
-
65
-
66
-
67
-
68
-
69
-
70
-
71
-
72
-
73
-
74
-
75
-
76
-
77
-
78
-
79
-
80
-
81
-
82
-
83
-
84
-
85
-
86
-
87
-
88
-
89
-
90
-
91
-
92
-
93
-
94
-
95
-
96
-
97
-
98
-
99
-
100
-
101
-
102
-
103
-
104
-
105
-
106
-
107
-
108
-
109
-
110
-
111
-
112
-
113
-
114
-
115
-
116
-
117
-
118
-
119
-
120
-
121
-
122
 |
 |
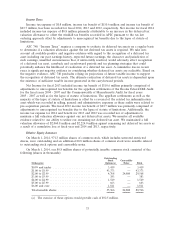
17APR201405431606
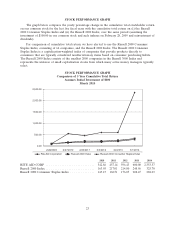
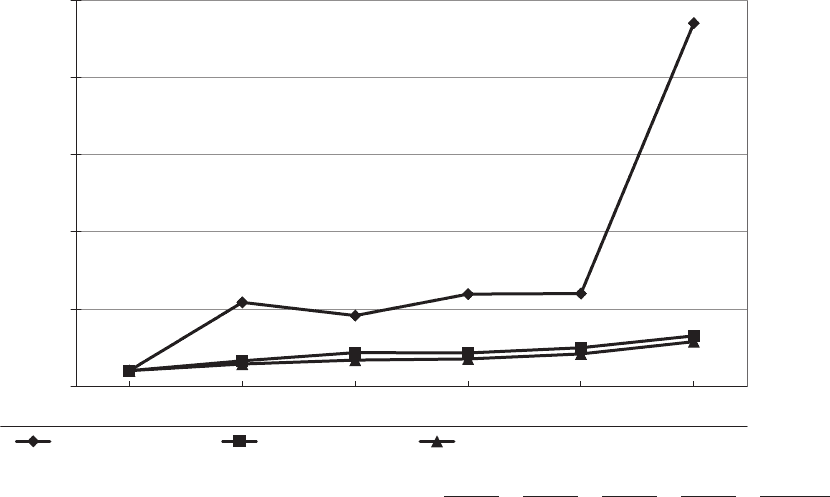
STOCK PERFORMANCE GRAPH
The graph below compares the yearly percentage change in the cumulative total stockholder return
on our common stock for the last five fiscal years with the cumulative total return on (i) the Russell
2000 Consumer Staples Index and (ii) the Russell 2000 Index, over the same period (assuming the
investment of $100.00 in our common stock and such indexes on February 28, 2009 and reinvestment of
dividends).
For comparison of cumulative total return, we have elected to use the Russell 2000 Consumer
Staples Index, consisting of 66 companies, and the Russell 2000 Index. The Russell 2000 Consumer
Staples Index is a capitalization-weighted index of companies that provide products directly to
consumers that are typically considered nondiscretionary items based on consumer purchasing habits.
The Russell 2000 Index consists of the smallest 2000 companies in the Russell 3000 Index and
represents the universe of small capitalization stocks from which many active money managers typically
select.
STOCK PERFORMANCE GRAPH
Comparison of 5 Year Cumulative Total Return
Assumes Initial Investment of $100
March 2014
0.00
500.00
1,000.00
1,500.00
2,500.00
2,000.00
2/28/2009 2/27/2010 2/26/2011 3/3/2012 3/2/2013 3/1/2014
Russell 2000 Consumer Staples IndexRussell 2000 IndexRite Aid Corporation
2010 2011 2012 2013 2014
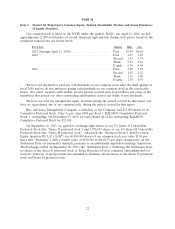
RITE AID CORP ............................ 542.86 457.14 596.43 600.00 2,353.57
Russell 2000 Index ............................ 163.95 217.01 214.80 248.56 325.70
Russell 2000 Consumer Staples Index .............. 143.15 168.51 176.05 208.47 288.03
23