Rite Aid 2014 Annual Report Download - page 59
Download and view the complete annual report
Please find page 59 of the 2014 Rite Aid annual report below. You can navigate through the pages in the report by either clicking on the pages listed below, or by using the keyword search tool below to find specific information within the annual report.-
 1
1 -
2
-
3
-
4
-
5
-
6
-
7
-
8
-
9
-
10
-
11
-
12
-
13
-
14
-
15
-
16
-
17
-
18
-
19
-
20
-
21
-
22
-
23
-
24
-
25
-
26
-
27
-
28
-
29
-
30
-
31
-
32
-
33
-
34
-
35
-
36
-
37
-
38
-
39
-
40
-
41
-
42
-
43
-
44
-
45
-
46
-
47
-
48
-
 49
49 -
 50
50 -
 51
51 -
 52
52 -
 53
53 -
 54
54 -
 55
55 -
 56
56 -
 57
57 -
 58
58 -
 59
59 -
 60
60 -
 61
61 -
 62
62 -
 63
63 -
 64
64 -
 65
65 -
 66
66 -
 67
67 -
 68
68 -
 69
69 -
70
-
71
-
72
-
73
-
74
-
75
-
76
-
77
-
78
-
79
-
80
-
81
-
82
-
83
-
84
-
85
-
86
-
87
-
88
-
89
-
90
-
91
-
92
-
93
-
94
-
95
-
96
-
97
-
98
-
99
-
100
-
101
-
102
-
103
-
104
-
105
-
106
-
107
-
108
-
109
-
110
-
111
-
112
-
113
-
114
-
115
-
116
-
117
-
118
-
119
-
120
-
121
-
122
 |
 |

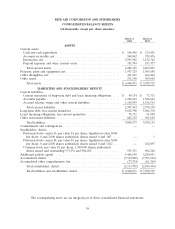
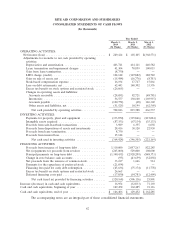
RITE AID CORPORATION AND SUBSIDIARIES
CONSOLIDATED BALANCE SHEETS
(In thousands, except per share amounts)
March 1, March 2,
2014 2013
ASSETS
Current assets:
Cash and cash equivalents ................................... $ 146,406 $ 129,452
Accounts receivable, net .................................... 949,062 929,476
Inventories, net ........................................... 2,993,948 3,154,742
Prepaid expenses and other current assets ....................... 195,709 195,377
Total current assets ...................................... 4,285,125 4,409,047
Property, plant and equipment, net .............................. 1,957,329 1,895,650
Other intangibles, net ........................................ 431,227 464,404
Other assets ............................................... 271,190 309,618
Total assets ............................................ $6,944,871 $ 7,078,719
LIABILITIES AND STOCKHOLDERS’ DEFICIT
Current liabilities:
Current maturities of long-term debt and lease financing obligations .... $ 49,174 $ 37,311
Accounts payable ......................................... 1,292,419 1,384,644
Accrued salaries, wages and other current liabilities ................ 1,165,859 1,156,315
Total current liabilities .................................... 2,507,452 2,578,270
Long-term debt, less current maturities ........................... 5,632,798 5,904,370
Lease financing obligations, less current maturities ................... 75,171 91,850
Other noncurrent liabilities .................................... 843,152 963,663
Total liabilities .......................................... 9,058,573 9,538,153
Commitments and contingencies ................................ — —
Stockholders’ deficit:
Preferred stock—series G, par value $1 per share; liquidation value $100
per share; 0 and 2,000 shares authorized; shares issued 0 and .007 .... — 1
Preferred stock—series H, par value $1 per share; liquidation value $100
per share; 0 and 2,000 shares authorized; shares issued 0 and 1,821 . . . — 182,097
Common stock, par value $1 per share; 1,500,000 shares authorized;
shares issued and outstanding 971,331 and 904,268 ............... 971,331 904,268
Additional paid-in capital ..................................... 4,468,149 4,280,831
Accumulated deficit ......................................... (7,515,848) (7,765,262)
Accumulated other comprehensive loss ........................... (37,334) (61,369)
Total stockholders’ deficit .................................. (2,113,702) (2,459,434)
Total liabilities and stockholders’ deficit ....................... $6,944,871 $ 7,078,719
The accompanying notes are an integral part of these consolidated financial statements.
58