Rite Aid 2014 Annual Report Download - page 62
Download and view the complete annual report
Please find page 62 of the 2014 Rite Aid annual report below. You can navigate through the pages in the report by either clicking on the pages listed below, or by using the keyword search tool below to find specific information within the annual report.-
 1
1 -
2
-
3
-
4
-
5
-
6
-
7
-
8
-
9
-
10
-
11
-
12
-
13
-
14
-
15
-
16
-
17
-
18
-
19
-
20
-
21
-
22
-
23
-
24
-
25
-
26
-
27
-
28
-
29
-
30
-
31
-
32
-
33
-
34
-
35
-
36
-
37
-
38
-
39
-
40
-
41
-
42
-
43
-
44
-
45
-
46
-
47
-
48
-
49
-
50
-
51
-
 52
52 -
 53
53 -
 54
54 -
 55
55 -
 56
56 -
 57
57 -
 58
58 -
 59
59 -
 60
60 -
 61
61 -
 62
62 -
 63
63 -
 64
64 -
 65
65 -
 66
66 -
 67
67 -
 68
68 -
 69
69 -
 70
70 -
 71
71 -
 72
72 -
73
-
74
-
75
-
76
-
77
-
78
-
79
-
80
-
81
-
82
-
83
-
84
-
85
-
86
-
87
-
88
-
89
-
90
-
91
-
92
-
93
-
94
-
95
-
96
-
97
-
98
-
99
-
100
-
101
-
102
-
103
-
104
-
105
-
106
-
107
-
108
-
109
-
110
-
111
-
112
-
113
-
114
-
115
-
116
-
117
-
118
-
119
-
120
-
121
-
122
 |
 |

61
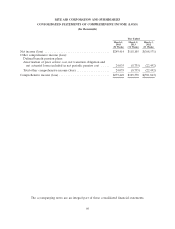
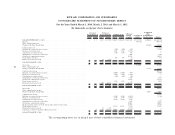
RITE AID CORPORATION AND SUBSIDIARIES
CONSOLIDATED STATEMENTS OF STOCKHOLDERS’ DEFICIT
For the Years Ended March 1, 2014, March 2, 2013 and March 3, 2012
(In thousands, except per share amounts)
Accumulated
Preferred Preferred Additional Other
Stock—Series G Stock—Series H Common Stock Paid-In Accumulated Comprehensive
Shares Amount Shares Amount Shares Amount Capital Deficit Income (Loss) Total
BALANCE FEBRUARY 26, 2011 .................................... — $1 1,616 $ 161,650 890,297 $890,297 $4,281,623 $(7,514,796) $(30,142) $(2,211,367)
Net loss .................................................. (368,571) (368,571)
Other comprehensive loss:
Changes in Defined Benefit Plans .................................... (22,492) (22,492)
Comprehensive loss ............................................ (391,063)
Exchange of restricted shares for taxes ................................. (970) (970) (132) (1,102)
Issuance of restricted stock ........................................ 9,195 9,195 (9,195) —
Cancellation of restricted stock ..................................... (731) (731) 731 —
Amortization of restricted stock balance ................................ 5,406 5,406
Stock-based compensation expense ................................... 10,456 10,456
Stock options exercised .......................................... 896 896 18 914
Dividends on preferred stock ...................................... 99 9,919 (9,919) —
BALANCE MARCH 3, 2012 ...................................... — $1 1,715 $ 171,569 898,687 $898,687 $4,278,988 $(7,883,367) $(52,634) $(2,586,756)
Net income ................................................ 118,105 118,105
Other comprehensive loss:
Changes in Defined Benefit Plans .................................... (8,735) (8,735)
Comprehensive income .......................................... 109,370
Exchange of restricted shares for taxes ................................. (1,060) (1,060) (348) (1,408)
Issuance of restricted stock ........................................ 5,450 5,450 (5,450) —
Cancellation of restricted stock ..................................... (360) (360) 360 —
Amortization of restricted stock balance ................................ 6,126 6,126
Stock-based compensation expense ................................... 11,588 11,588
Stock options exercised .......................................... 1,551 1,551 95 1,646
Dividends on preferred stock ...................................... 106 10,528 (10,528) —
BALANCE MARCH 2, 2013 ...................................... — $1 1,821 $ 182,097 904,268 $904,268 $4,280,831 $(7,765,262) $(61,369) $(2,459,434)
Net income ................................................ 249,414 249,414
Other comprehensive income:
Changes in Defined Benefit Plans .................................... 24,035 24,035
Comprehensive income .......................................... 273,449
Exchange of restricted shares for taxes ................................. (1,341) (1,341) (2,452) (3,793)
Issuance of restricted stock ........................................ 2,743 2,743 (2,743) —
Cancellation of restricted stock ..................................... (1,212) (1,212) 1,212 —
Amortization of restricted stock balance ................................ 6,146 6,146
Stock-based compensation expense ................................... 10,048 10,048
Tax benefit from exercise of stock options and restricted stock vesting ................ 26,665 26,665
Stock options exercised .......................................... 26,873 26,873 6,344 33,217
Dividends on preferred stock ...................................... 83 8,318 (8,318) —
Conversion of Series G and Series H preferred stock ......................... (1) (1,904) (190,415) 40,000 40,000 150,416 —
BALANCE MARCH 1, 2014 ...................................... — $— — $ — 971,331 $971,331 $4,468,149 $(7,515,848) $(37,334) $(2,113,702)
The accompanying notes are an integral part of these consolidated financial statements.