Rite Aid 2014 Annual Report Download - page 31
Download and view the complete annual report
Please find page 31 of the 2014 Rite Aid annual report below. You can navigate through the pages in the report by either clicking on the pages listed below, or by using the keyword search tool below to find specific information within the annual report.-
 1
1 -
2
-
3
-
4
-
5
-
6
-
7
-
8
-
9
-
10
-
11
-
12
-
13
-
14
-
15
-
16
-
17
-
18
-
19
-
20
-
 21
21 -
 22
22 -
 23
23 -
 24
24 -
 25
25 -
 26
26 -
 27
27 -
 28
28 -
 29
29 -
 30
30 -
 31
31 -
 32
32 -
 33
33 -
 34
34 -
 35
35 -
 36
36 -
 37
37 -
 38
38 -
 39
39 -
 40
40 -
 41
41 -
42
-
43
-
44
-
45
-
46
-
47
-
48
-
49
-
50
-
51
-
52
-
53
-
54
-
55
-
56
-
57
-
58
-
59
-
60
-
61
-
62
-
63
-
64
-
65
-
66
-
67
-
68
-
69
-
70
-
71
-
72
-
73
-
74
-
75
-
76
-
77
-
78
-
79
-
80
-
81
-
82
-
83
-
84
-
85
-
86
-
87
-
88
-
89
-
90
-
91
-
92
-
93
-
94
-
95
-
96
-
97
-
98
-
99
-
100
-
101
-
102
-
103
-
104
-
105
-
106
-
107
-
108
-
109
-
110
-
111
-
112
-
113
-
114
-
115
-
116
-
117
-
118
-
119
-
120
-
121
-
122
 |
 |
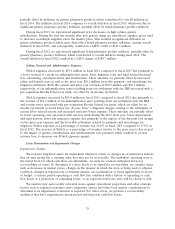
In performing the recoverability test, we compare the expected future cash flows of a store to the
carrying amount of its assets. Significant judgment is used to estimate future cash flows. Major
assumptions that contribute to our future cash flow projections include expected sales, gross profit, and
distribution expenses; expected costs such as payroll, occupancy costs and advertising expenses; and
estimates for other significant selling, and general and administrative expenses. Many long-term macro-
economic and industry factors are considered, both quantitatively and qualitatively, in our future cash
flow assumptions. In addition to current and expected economic conditions such as inflation, interest
and unemployment rates that affect customer shopping patterns, we consider that we operate in a
highly competitive industry which includes the actions of other national and regional drugstore chains,
independently owned drugstores, supermarkets, mass merchandisers, dollar stores and internet
pharmacies. Many of our competitors are spending significant capital and promotional dollars in certain
geographies to gain market share. We have assumed certain sales growth from our loyalty program and
other initiatives to grow sales. Recent Pharmacy Benefit Management consolidation and efforts of third
party public and private payors have reduced pharmacy reimbursement rates in recent years. We expect
this rate compression, which currently affects 97% of our pharmacy business, to continue to affect us in
the foreseeable future. We operate in a highly regulated industry and must make assumptions related
to Federal and State efforts and proposals to affect the pricing and regulations related to prescription
drugs, as well as, expected revenues and costs related to the Patient Protection and Affordable Care
Act (health care reform).
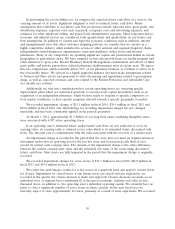
Additionally, we take into consideration that certain operating stores are executing specific
improvement plans which are monitored quarterly to recoup recent capital investments, such as an
acquisition of an independent pharmacy, which we have made to respond to specific competitive or
local market conditions, or have specific programs tailored towards a specific geography or market.
We recorded impairment charges of $13.1 million in fiscal 2014, $24.9 million in fiscal 2013 and
$52.0 million in fiscal 2012. Our methodology for recording impairment charges has not changed
materially, and has been consistently applied in the periods presented.
At March 1, 2014, approximately $1.9 billion of our long-lived assets, including intangible assets,
were associated with 4,587 active operating stores.
If an operating store’s estimated future undiscounted cash flows are not sufficient to cover its
carrying value, its carrying value is reduced to fair value which is its estimated future discounted cash
flows. The discount rate is commensurate with the risks associated with the recovery of a similar asset.
An impairment charge is recorded in the period that the store does not meet its original return on
investment and/or has an operating loss for the last two years and its projected cash flows do not
exceed its current asset carrying value. The amount of the impairment charge is the entire difference
between the current carrying asset value and the estimated fair value of the assets using discounted
future cash flows. Most stores are fully impaired in the period that the impairment charge is originally
recorded.
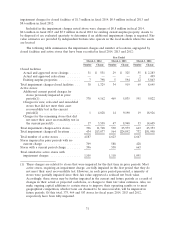
We recorded impairment charges for active stores of $11.7 million in fiscal 2014, $24.0 million in
fiscal 2013 and $43.4 million in fiscal 2012.
We review key performance results for active stores on a quarterly basis and approve certain stores
for closure. Impairment for closed stores, if any (many stores are closed on lease expiration), are
recorded in the quarter the closure decision is made and approved. Closure decisions are made on an
individual store or regional basis considering all of the macro-economic, industry and other factors
discussed above, in addition to, the operating store’s individual operating results. We currently have no
plans to close a significant number of active stores in future periods. In the next fiscal year, we
currently expect to close approximately 40 stores, primarily as a result of lease expirations. We recorded
30