Rite Aid 2014 Annual Report Download - page 26
Download and view the complete annual report
Please find page 26 of the 2014 Rite Aid annual report below. You can navigate through the pages in the report by either clicking on the pages listed below, or by using the keyword search tool below to find specific information within the annual report.-
 1
1 -
2
-
3
-
4
-
5
-
6
-
7
-
8
-
9
-
10
-
11
-
12
-
13
-
14
-
15
-
 16
16 -
 17
17 -
 18
18 -
 19
19 -
 20
20 -
 21
21 -
 22
22 -
 23
23 -
 24
24 -
 25
25 -
 26
26 -
 27
27 -
 28
28 -
 29
29 -
 30
30 -
 31
31 -
 32
32 -
 33
33 -
 34
34 -
 35
35 -
 36
36 -
37
-
38
-
39
-
40
-
41
-
42
-
43
-
44
-
45
-
46
-
47
-
48
-
49
-
50
-
51
-
52
-
53
-
54
-
55
-
56
-
57
-
58
-
59
-
60
-
61
-
62
-
63
-
64
-
65
-
66
-
67
-
68
-
69
-
70
-
71
-
72
-
73
-
74
-
75
-
76
-
77
-
78
-
79
-
80
-
81
-
82
-
83
-
84
-
85
-
86
-
87
-
88
-
89
-
90
-
91
-
92
-
93
-
94
-
95
-
96
-
97
-
98
-
99
-
100
-
101
-
102
-
103
-
104
-
105
-
106
-
107
-
108
-
109
-
110
-
111
-
112
-
113
-
114
-
115
-
116
-
117
-
118
-
119
-
120
-
121
-
122
 |
 |
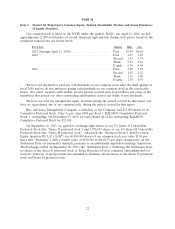
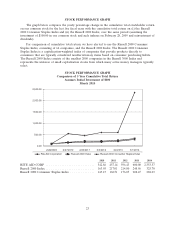
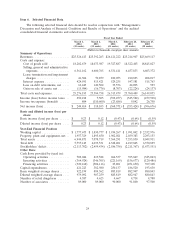
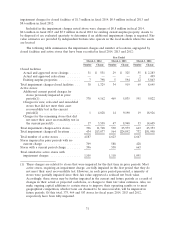
Item 7. Management’s Discussion and Analysis of Financial Condition and Results of Operations
Overview
Net income for fiscal 2014 was $249.4 million or $0.23 per basic and diluted share compared to net
income for fiscal 2013 of $118.1 million or $0.12 per basic and diluted share. Contributing to the
increase in net income was an increase in Adjusted EBITDA and lower interest expense, loss on debt
retirement of $62.4 million versus $140.5 million in the prior year, and lower lease termination and
impairment charges. Partially offsetting these improvements is a LIFO charge of $104.1 million in fiscal
2014 compared to a LIFO credit of $147.9 million in fiscal 2013.
Adjusted EBITDA for fiscal 2014 was $1,325.0 million or 5.2 percent of revenues, compared to
$1,128.4 million or 4.4% of revenues for fiscal year 2013. The increase in Adjusted EBITDA was driven
by increased pharmacy gross profit due to the continued benefit of generic introductions on pharmacy
gross margin in the first half of the fiscal year, purchasing efficiencies on generic drugs and strong cost
control.
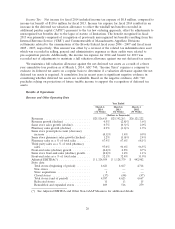
Our operating results are described in more detail in the ‘‘Results of Operations’’ section below.
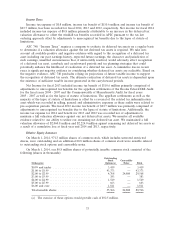
Some of the key factors that impacted our results are summarized as follows:
Sales Trends: Our revenue growth for fiscal 2014 was 0.5% compared to revenue decline of 2.8%
for fiscal 2013. Fiscal 2014 revenues were positively impacted by an increase in same store sales,
partially offset by a decrease in same store prescription count and a negative impact from generic
introductions and continued lower reimbursement rates and store closings.
Gross Profit: Our gross profit was positively impacted by the continued impact of generic
introductions, which have a higher gross profit than their brand counterparts, and purchasing
efficiencies on generic drugs, offset by a higher LIFO charge. We record the value of our inventory on
the Last-In, First-Out (LIFO) method. We recorded a LIFO charge of $104.1 million and a LIFO
credit of $147.9 million in fiscal 2014 and 2013, respectively. The current year LIFO charge was due to
higher pharmacy inflation rates.
Selling, General and Administrative Expenses: Our selling, general and administrative expenses
(‘‘SG&A’’) decreased in fiscal 2014 due primarily to a lower reversal of certain tax indemnifications
assets, lower litigation costs and legal and professional fees, advertising, and depreciation and
amortization. These amounts are partially offset by increased salary and benefit costs as well as the
prior year $18.1 million favorable payment card interchange fee litigation settlement. Both the current
and prior year reversals of $30.5 million and $91.3 million of tax indemnification assets resulting from
our settlement with the IRS associated with a pre-acquisition Brooks Eckerd tax audit are offset by an
income tax benefit.
Lease Termination and Impairment Charges: We recorded lease terminations and impairment
charges of $41.3 million in fiscal 2014 compared to $70.9 million in fiscal 2013. Our charges have been
trending lower due to improved results of operations, which reduces our impairment charges, and
closing fewer stores that require lease termination charges.
Debt Refinancing and Other Capital Transactions: During fiscal 2014, we continued to take steps to
extend the terms of our debt, reduce interest expense and to obtain more flexibility. We expect to
engage in similar efforts in the future. During fiscal 2014 and fiscal 2013, we completed several
refinancing transactions which caused interest expense to decrease over $90.0 million in fiscal 2014. In
March 2014, we completed the refinancing of our Tranche 6 Term Loan with our new Tranche 7 Term
Loan which will reduce interest expense by an additional $5.0 million per year. These transactions are
described in more detail in the ‘‘Liquidity and Capital Resources’’ section below.
25