Qantas 2010 Annual Report Download - page 88
Download and view the complete annual report
Please find page 88 of the 2010 Qantas annual report below. You can navigate through the pages in the report by either clicking on the pages listed below, or by using the keyword search tool below to find specific information within the annual report.-
 1
1 -
2
-
3
-
4
-
5
-
6
-
7
-
8
-
9
-
10
-
11
-
12
-
13
-
14
-
15
-
16
-
17
-
18
-
19
-
20
-
21
-
22
-
23
-
24
-
25
-
26
-
27
-
28
-
29
-
30
-
31
-
32
-
33
-
34
-
35
-
36
-
37
-
38
-
39
-
40
-
41
-
42
-
43
-
44
-
45
-
46
-
47
-
48
-
49
-
50
-
51
-
52
-
53
-
54
-
55
-
56
-
57
-
58
-
59
-
60
-
61
-
62
-
63
-
64
-
65
-
66
-
67
-
68
-
69
-
70
-
71
-
72
-
73
-
74
-
75
-
76
-
77
-
 78
78 -
 79
79 -
 80
80 -
 81
81 -
 82
82 -
 83
83 -
 84
84 -
 85
85 -
 86
86 -
 87
87 -
 88
88 -
 89
89 -
 90
90 -
 91
91 -
 92
92 -
 93
93 -
 94
94 -
 95
95 -
 96
96 -
 97
97 -
 98
98 -
99
-
100
-
101
-
102
-
103
-
104
-
105
-
106
-
107
-
108
-
109
-
110
-
111
-
112
-
113
-
114
-
115
-
116
-
117
-
118
-
119
-
120
 |
 |

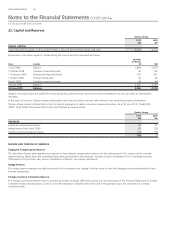
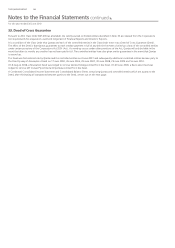
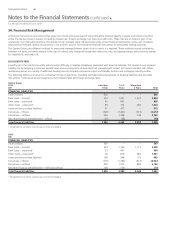
THE QANTAS GROUP 86
for the year ended 30 June 2010
Notes to the Financial Statements continued
Qantas Group
2010
$M
2009
$M
2008
$M
2007
$M
2006
$M
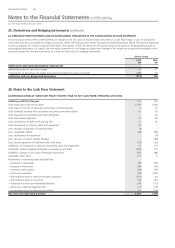
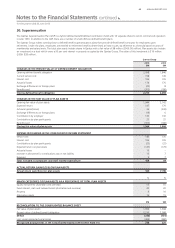
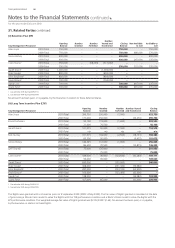
HISTORICAL AMOUNTS
Fair value of plan assets 1,964 1,944 2,142 2,353 2,411
Present value of de ned bene t obligation 2,210 2,098 1,846 1,691 2,042
(De cit)/surplus (246) (154) 296 662 369
Experience adjustments on plan assets 36 (343) (271) 27 180
Experience adjustments on plan liabilities (81) (37) (138) 112 4
Qantas Group
2010
%
2009
%
PRINCIPAL ACTUARIAL ASSUMPTIONS (EXPRESSED AS WEIGHTED AVERAGES PER ANNUM)
Discount rate 5.3 5.7
Expected return on plan assets 7.4 7.6
Future salary increases 3.0 3.0
The expected long-term rate of return is based on the weighted average of expected returns on each individual asset class where the weightings
re ect the proportion of de ned bene t assets invested in each asset class. Each asset class’ expected return is based on expectations of average
returns over the next 10 years.
Employer contributions to the de ned bene t superannuation plans are based on recommendations by the plans’ actuaries. It is estimated that
$108 million will be paid by Qantas for employees accruing de ned bene ts in the year ended 30 June 2011 (2010: $121 million).
In April 2009, Qantas and the Trustee of the QSP agreed to additional funding of up to $66 million over three years following the adverse performance
of investment markets as a result of the Global Financial Crisis. As at 30 June 2010, Qantas has contributed $35 million of the additional funding.
De ned contribution fund
The Qantas Group’s results include $142 million (2009: $131 million) of expenses in relation to de ned contribution funds.
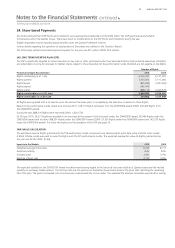
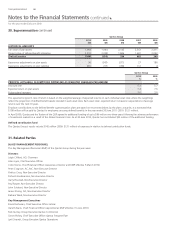
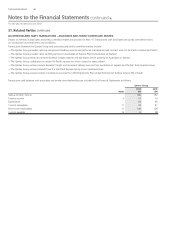
31. Related Parties
(A) KEY MANAGEMENT PERSONNEL
The Key Management Personnel (KMP) of the Qantas Group during the year were:
Directors
Leigh Clifford, AO, Chairman
Alan Joyce, Chief Executive Of cer
Colin Storrie, Chief Financial Of cer (ceased as a Director and KMP effective 5 March 2010)
Peter Cosgrove, AC, MC, Non-Executive Director
Patricia Cross, Non-Executive Director
Richard Goodmanson, Non-Executive Director
Garry Hounsell, Non-Executive Director
Paul Rayner, Non-Executive Director
John Schubert, Non-Executive Director
James Strong, AO, Non-Executive Director
Barbara Ward, Non-Executive Director
Key Management Executives
Bruce Buchanan, Chief Executive Of cer Jetstar
Gareth Evans, Chief Financial Of cer (appointed as KMP effective 15 June 2010)
Rob Gurney, Group Executive Qantas Commercial
Simon Hickey, Chief Executive Of cer Qantas Frequent Flyer
Lyell Strambi, Group Executive Qantas Operations
30. Superannuation continued